
Win Contribution: Quantifying an IPL Player's Value
How valuable is a particular player in a given season?
Every IPL season ends the same way. One team lifts the trophy, nine teams go home, and the debate immediately starts. Who was the best player this year? Who actually won games for their franchise? Who was criminally overpaid, and who left money on the table?
The honest answer?
For 17 years, nobody really knows.
We have opinions. We have highlights. We have the BCCI’s official “Player of the Tournament” award (nothing more than an arbitrary determination of who had the best season). Opinions are fine. Highlights are fun. But neither of them is a rigorous accounting of who actually moved the needle.
With the IPL regular season having come to an end, here’s an attempt to build that accounting. A single number, for every player, in every IPL season since 2008, that tries to answer one question: how many wins was this particular player worth?
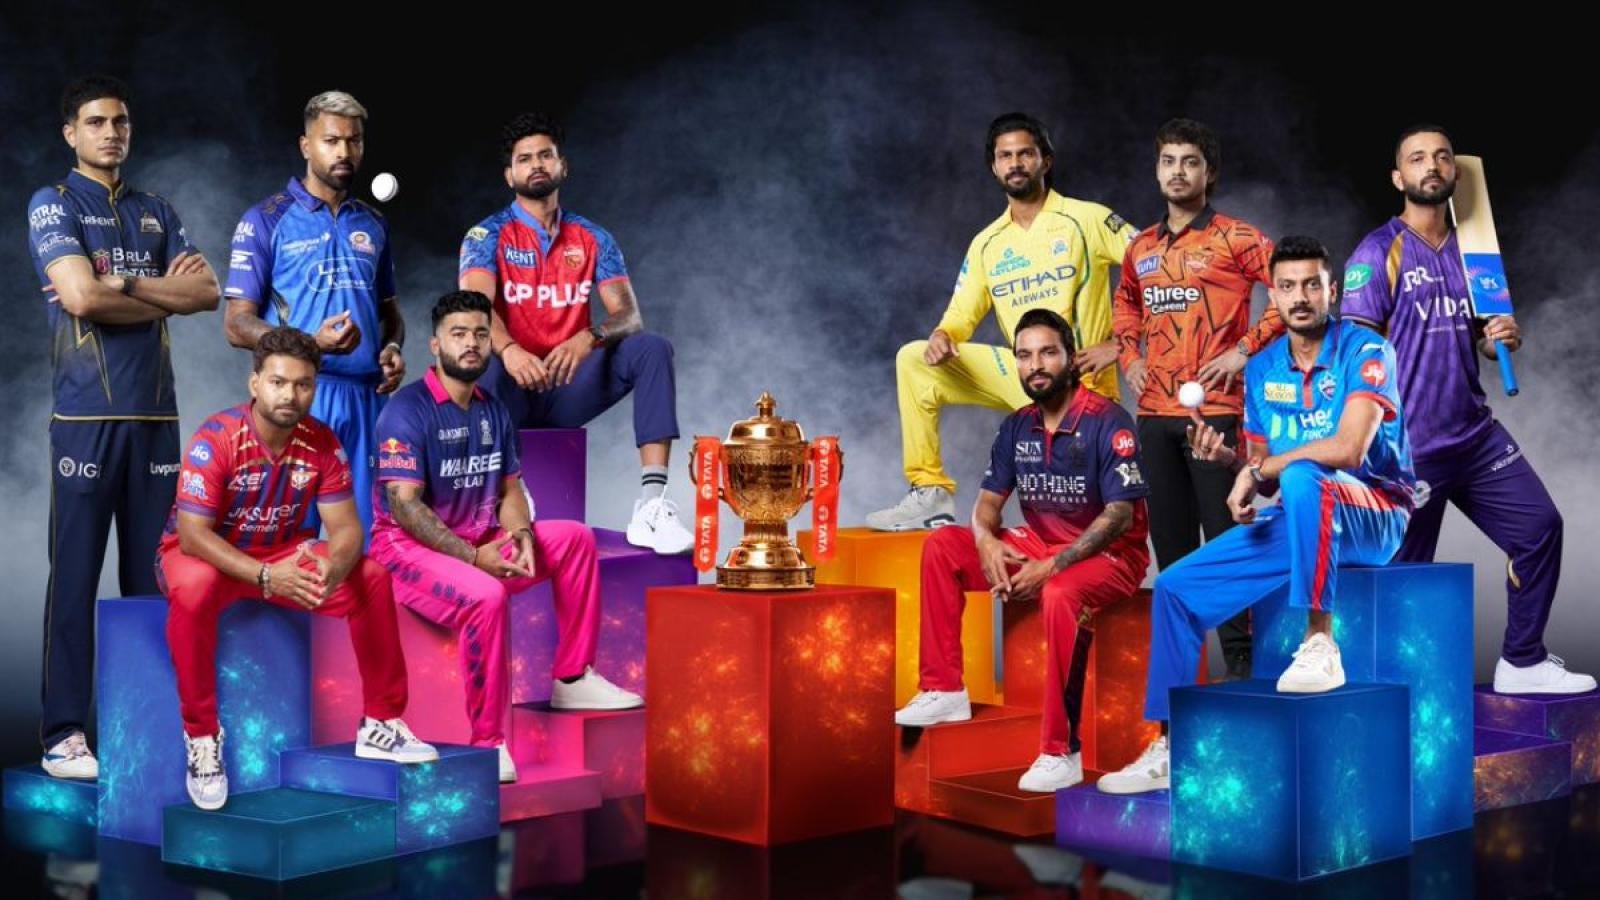
Statistic: Win Contribution
(Valuing a player’s individual performance in terms of the impact it has on winning)
The Data
The dataset comes from ESPNcricinfo and Kaggle. It covers seventeen years, 3,134 player-seasons. 766 players, and 16 franchises.
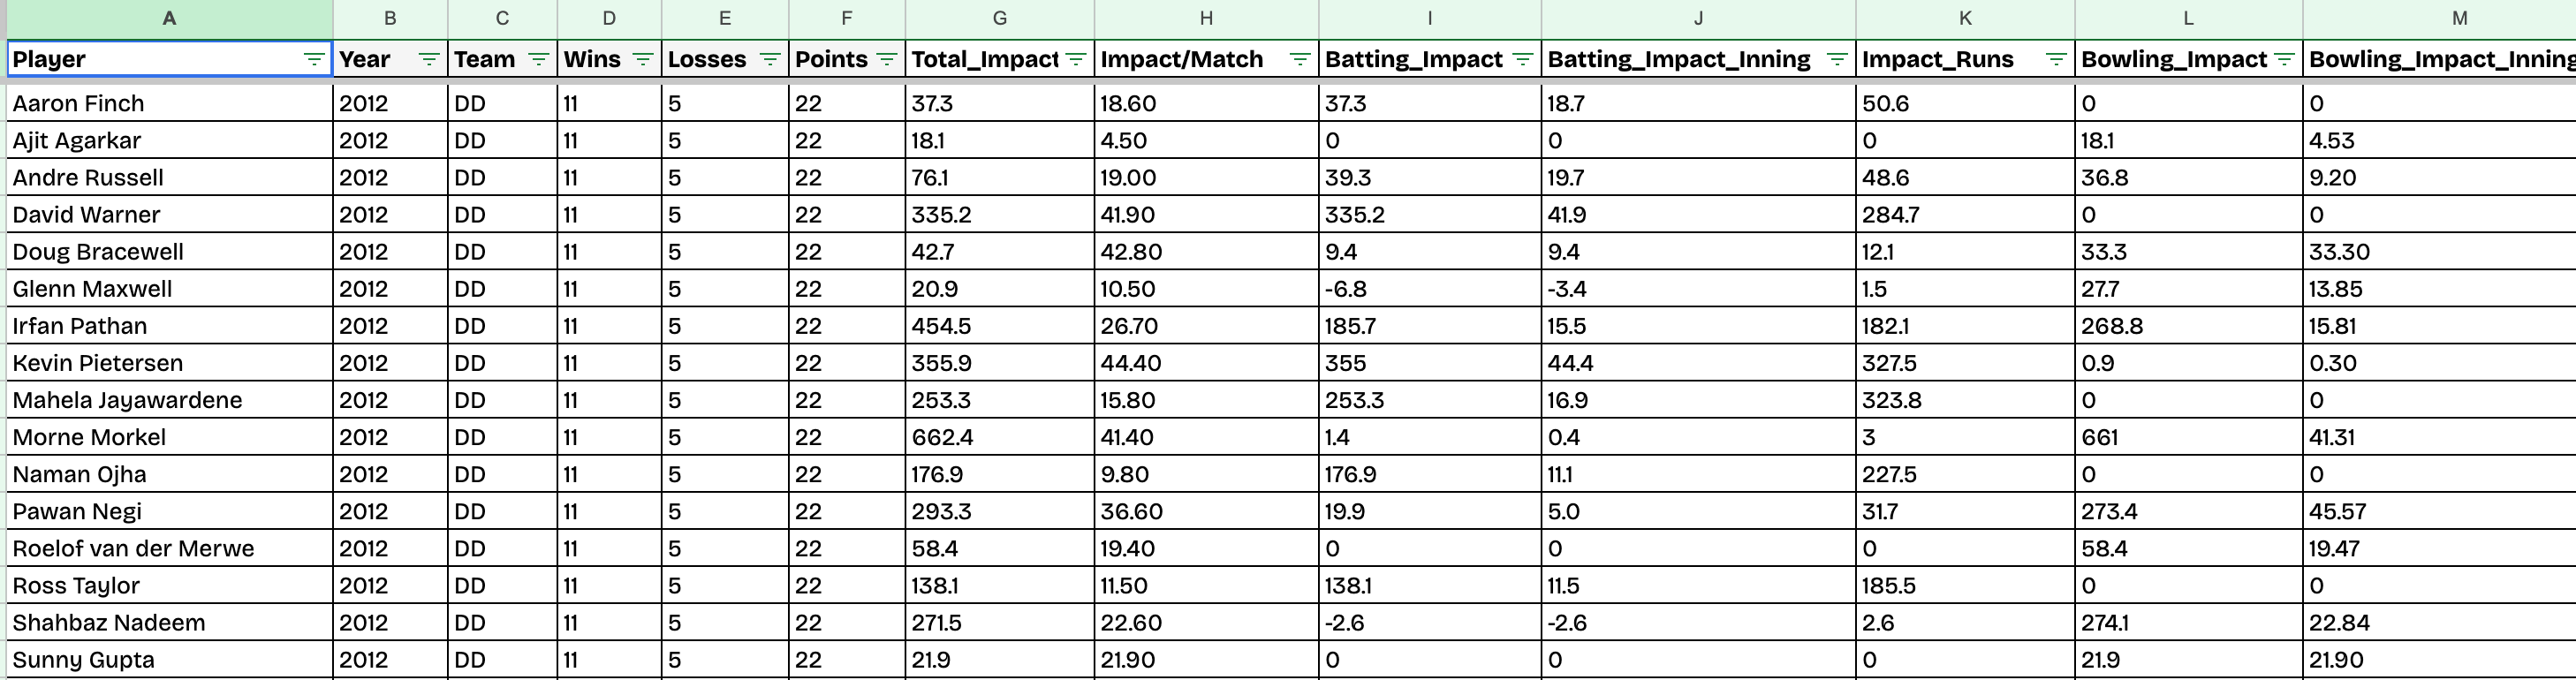
Every player-season has three layers of information:
Counting stats: Basics. Runs scored. Wickets taken. Innings batted. Balls bowled.
Per-game and per-innings rates: Dividing counting stats by opportunity. A bowler taking 10 wickets in 15 matches is extremely different from a bowler who takes 10 wickets in 8 matches. Raw numbers without context aren’t just incomplete, they’re actively misleading.
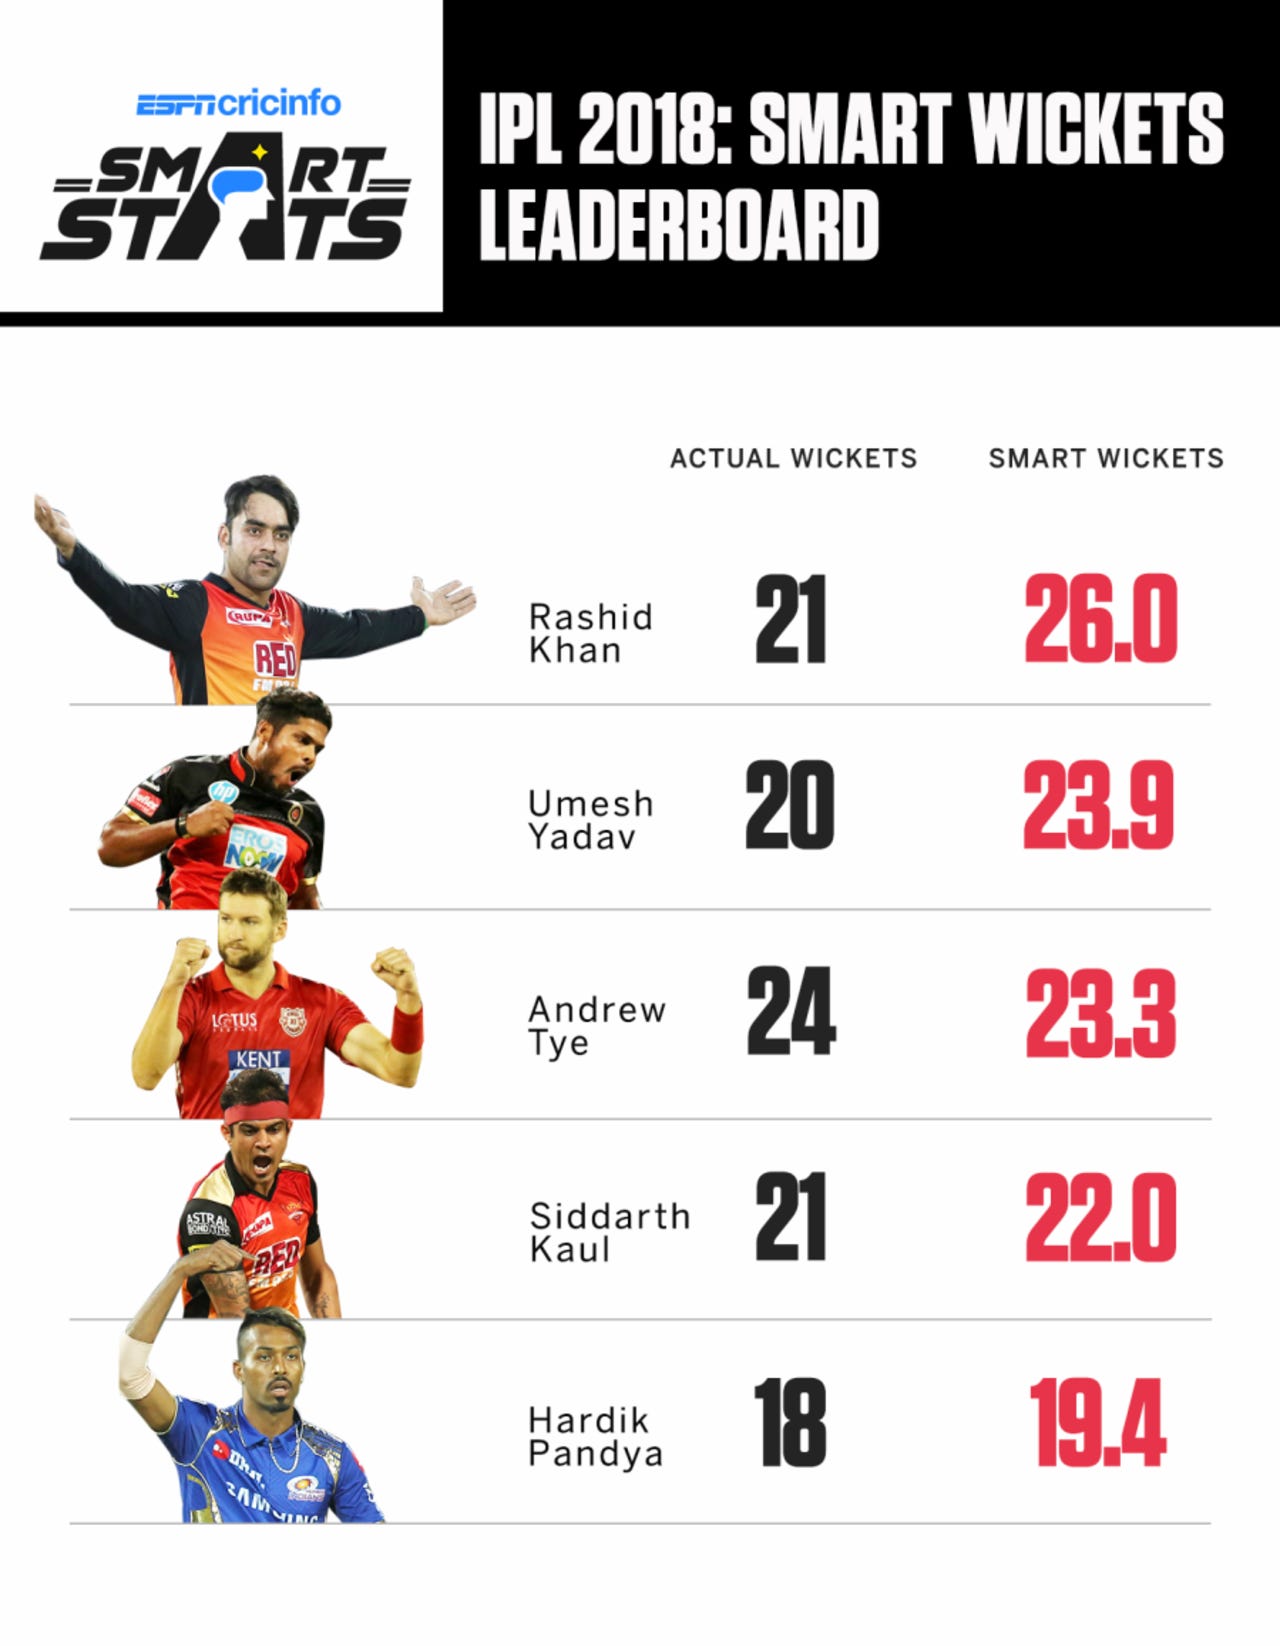
ESPN’s Impact Index: The Impact Index tries to answer a question that regular statistics cannot. How contextually important were a player’s runs and wickets? Scoring 50 in the 18th over of an already decided game is not as important as a 50 in the 12th over while chasing a massive total. The Impact Index accounts for this by weighting statistics against their context, producing a Batting Impact score, a Bowling Impact score, and a Total Impact score for every season.
The Methodology (How Does Virat Kohli turn into a Number?)
The First Problem: What Is a Win, Exactly?
Before building anything, it’s important to understand that, unlike many sports, Cricket doesn’t lend itself naturally to individual win contributions. One pitcher can throw a complete game. One quarterback can attempt every pass. But a cricket team fields eleven players, each with a designated role, much like American Football (another sport lacking a Win Contribution-esque metric).
The approach here works backwards from team results. Each player’s stats are recorded against their team’s win rate for that season (wins/total games). The goal is to identify player statistics that, when aggregated across a whole team, best predict that win rate. Once you know that, you can run it in reverse: take an individual player’s stats, compare them to a baseline, and estimate how many wins they added.
It has its flaws, but after spending weeks on this problem, I do not seem to have a better solution.
Step 1: A First Look (Do Individual Stats Even Predict Wins?)
Having checked the dataset and ensured no data is missing, let’s see if any stats correlate with win rate at the individual level.
The answer, bluntly, is not that much.
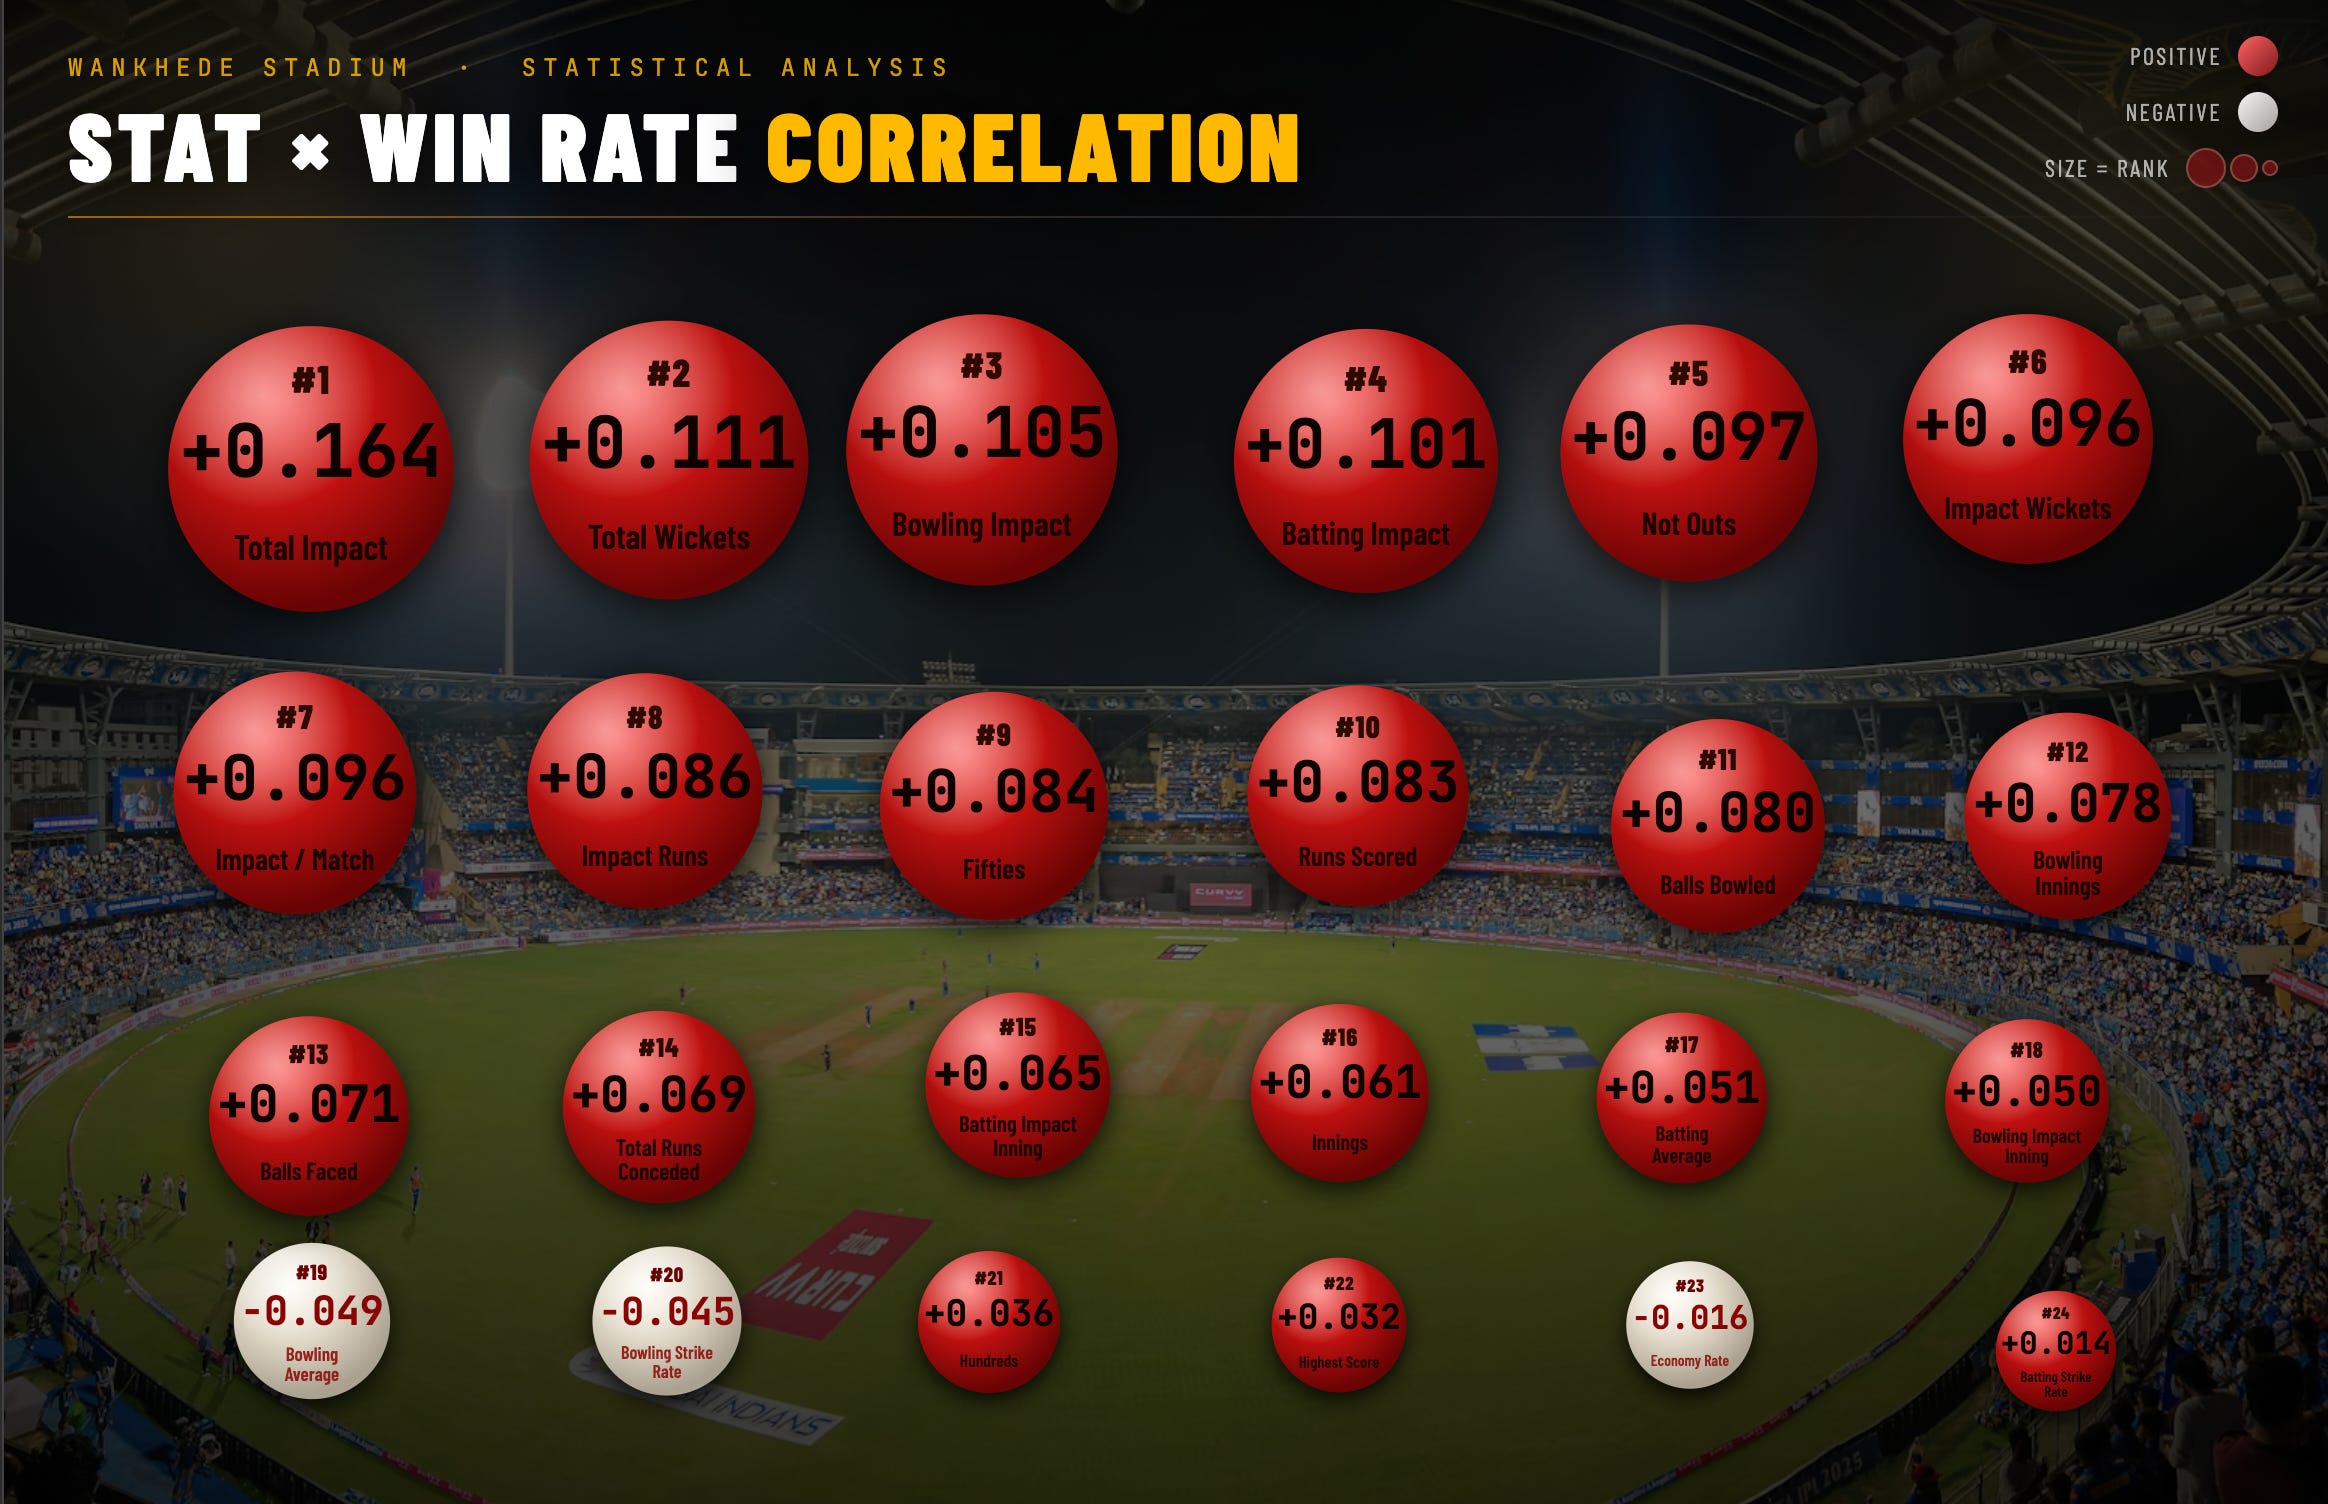
The correlation values are not statistically significant. Total Impact, the single best predictor, explains just 16% of a player’s team’s win rate. In my opinion, this isn’t a data quality problem, but a cricket problem.
We see brilliant players on terrible teams, and we see average players surrounded by four match-winners. Individual numbers and team outcomes don’t line up cleanly at the player level, and pretending otherwise would produce a deeply dishonest model.
The next step tries to account for this disconnection.
Step 2: Zoom Out to the Team Level
Instead of looking at players one by one, let’s aggregate everything by team and season. Every player from, say, 2013 MI is combined into a single row by taking a weighted average of all their stats (accounting for the number of matches each player played).
This produces 156 team-season observations. One row per franchise per year.
Now look at what happens to those same correlations:
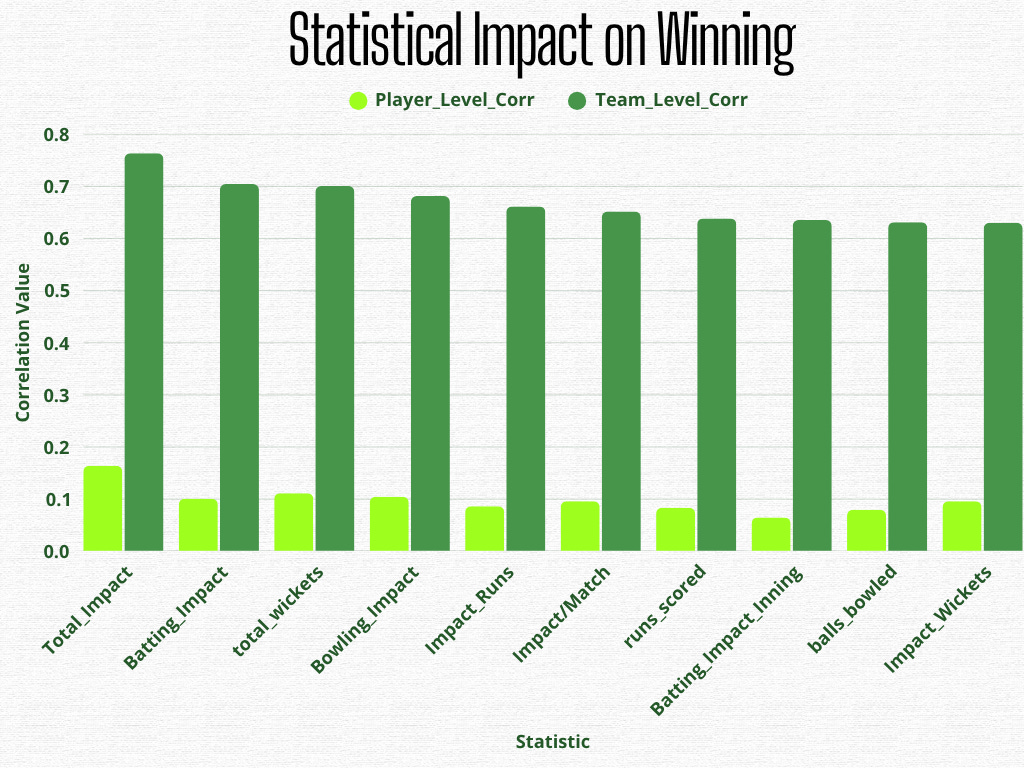
Everything strengthens dramatically. When a whole team produces high-impact scores, they win. The noise of individual circumstance, being on the weak side, batting at nine, not getting to bowl in a rain-affected game, averages out at the team level, and the real signal surfaces.
The model is built on these 156 observations, and then carefully walked back to the individual player level at the end.
Step 5: The Redundancy Problem
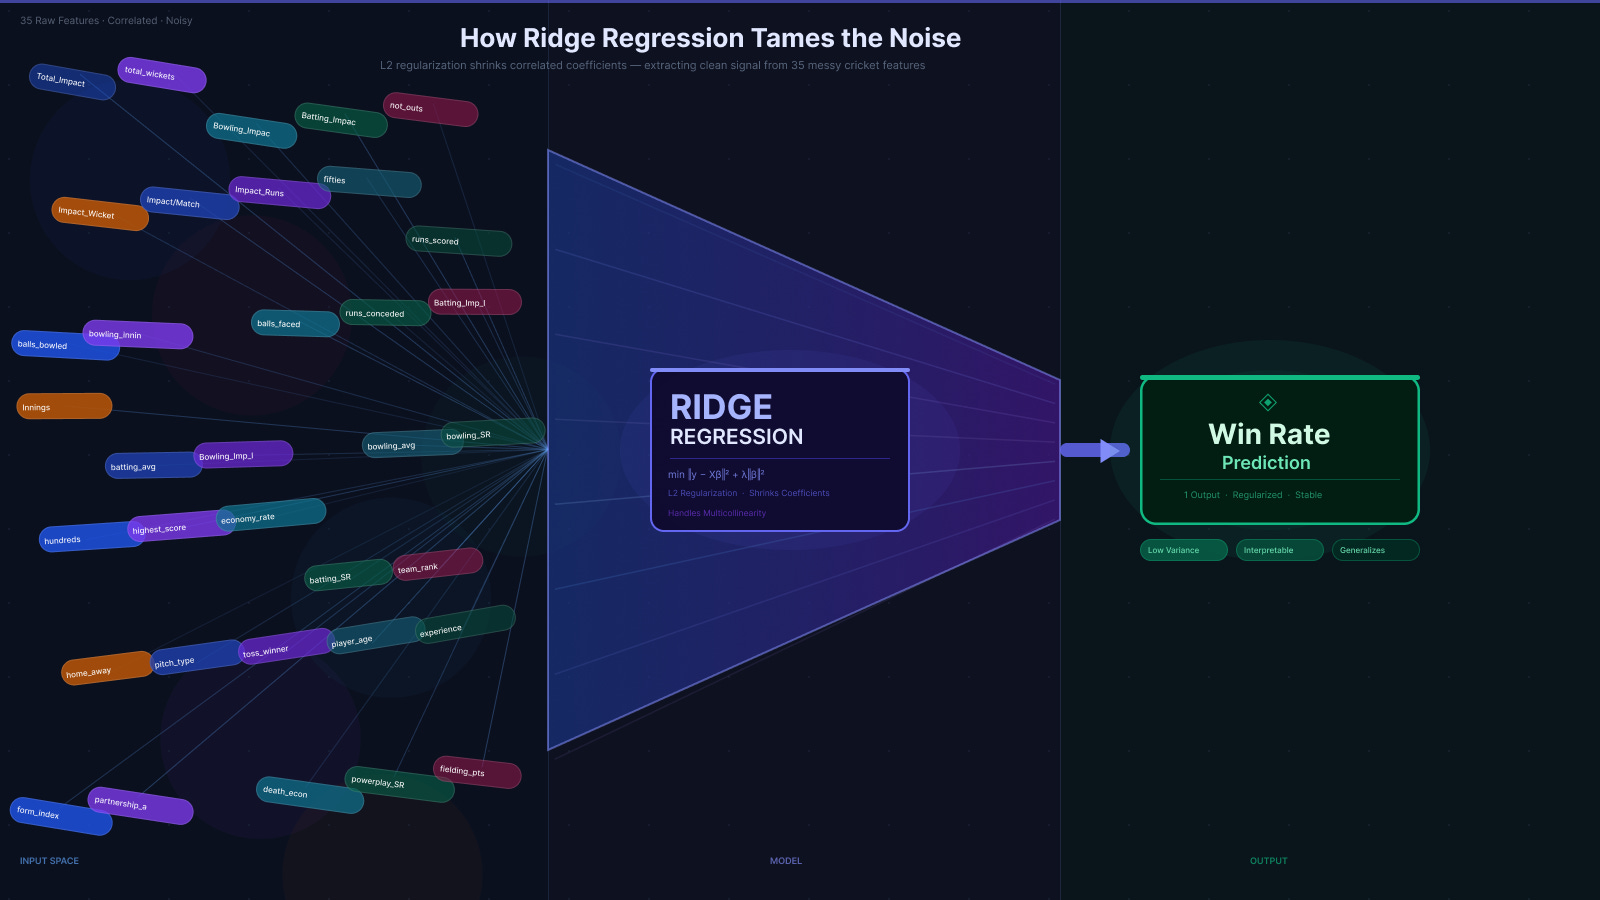
Here’s an awkward statistical truth: most of these 35 features provide similar information. Total Impact is the sum of Batting Impact and Bowling Impact. Runs scored and runs per match are nearly identical once you control for games played.
The technical term is multicollinearity, and this dataset has it in abundance. Throw all 35 correlated features into a standard model simultaneously, and they fight each other for credit; coefficients become unstable, one stat claims all the glory because it happens to correlate with six others, and the results stop meaning anything.
The solution is Ridge Regression, a modelling technique that acts like a strict scorekeeper, preventing any one stat from hogging all the credit just because it’s correlated with everything else. It gently shrinks inflated coefficients toward zero and distributes credit more evenly across related features.
Step 6: Does It Actually Work?
A model that fits its own training data perfectly is useless. It has just memorised the answers. The real test is whether it can predict win rates for teams it has never seen before.
Grouped 5-Fold Cross-Validation: Divide all franchises into five groups. Train on four groups, test on the fifth. Rotate. No team ever appears in both training and testing in the same fold.
The Grouped 5-fold method achieves an R² of 0.594. The model explains roughly 60% of the variation in team win rates. In a game where rain interruptions and toss luck and one inspired over from a part-time spinner can flip a result, that’s a strong result.
A second, more flexible model (Gradient Boosting) was also run as a cross-check. It confirmed broadly the same feature rankings and achieved similar out-of-sample accuracy (R² of 0.535). When two very different modelling approaches agree on which stats matter, you can be more confident that the answer is real.
Step 7: What Actually Predicts Winning?
After combining results from three separate methods, Ridge Regression coefficients, SHAP analysis (a technique that measures each feature’s precise contribution to every individual prediction), and raw team-level correlations, a composite ranking of all 35 features emerges. Every stat gets ranked by each method independently. The average of those three ranks becomes its Composite Rank: a consensus view of what actually drives IPL wins.
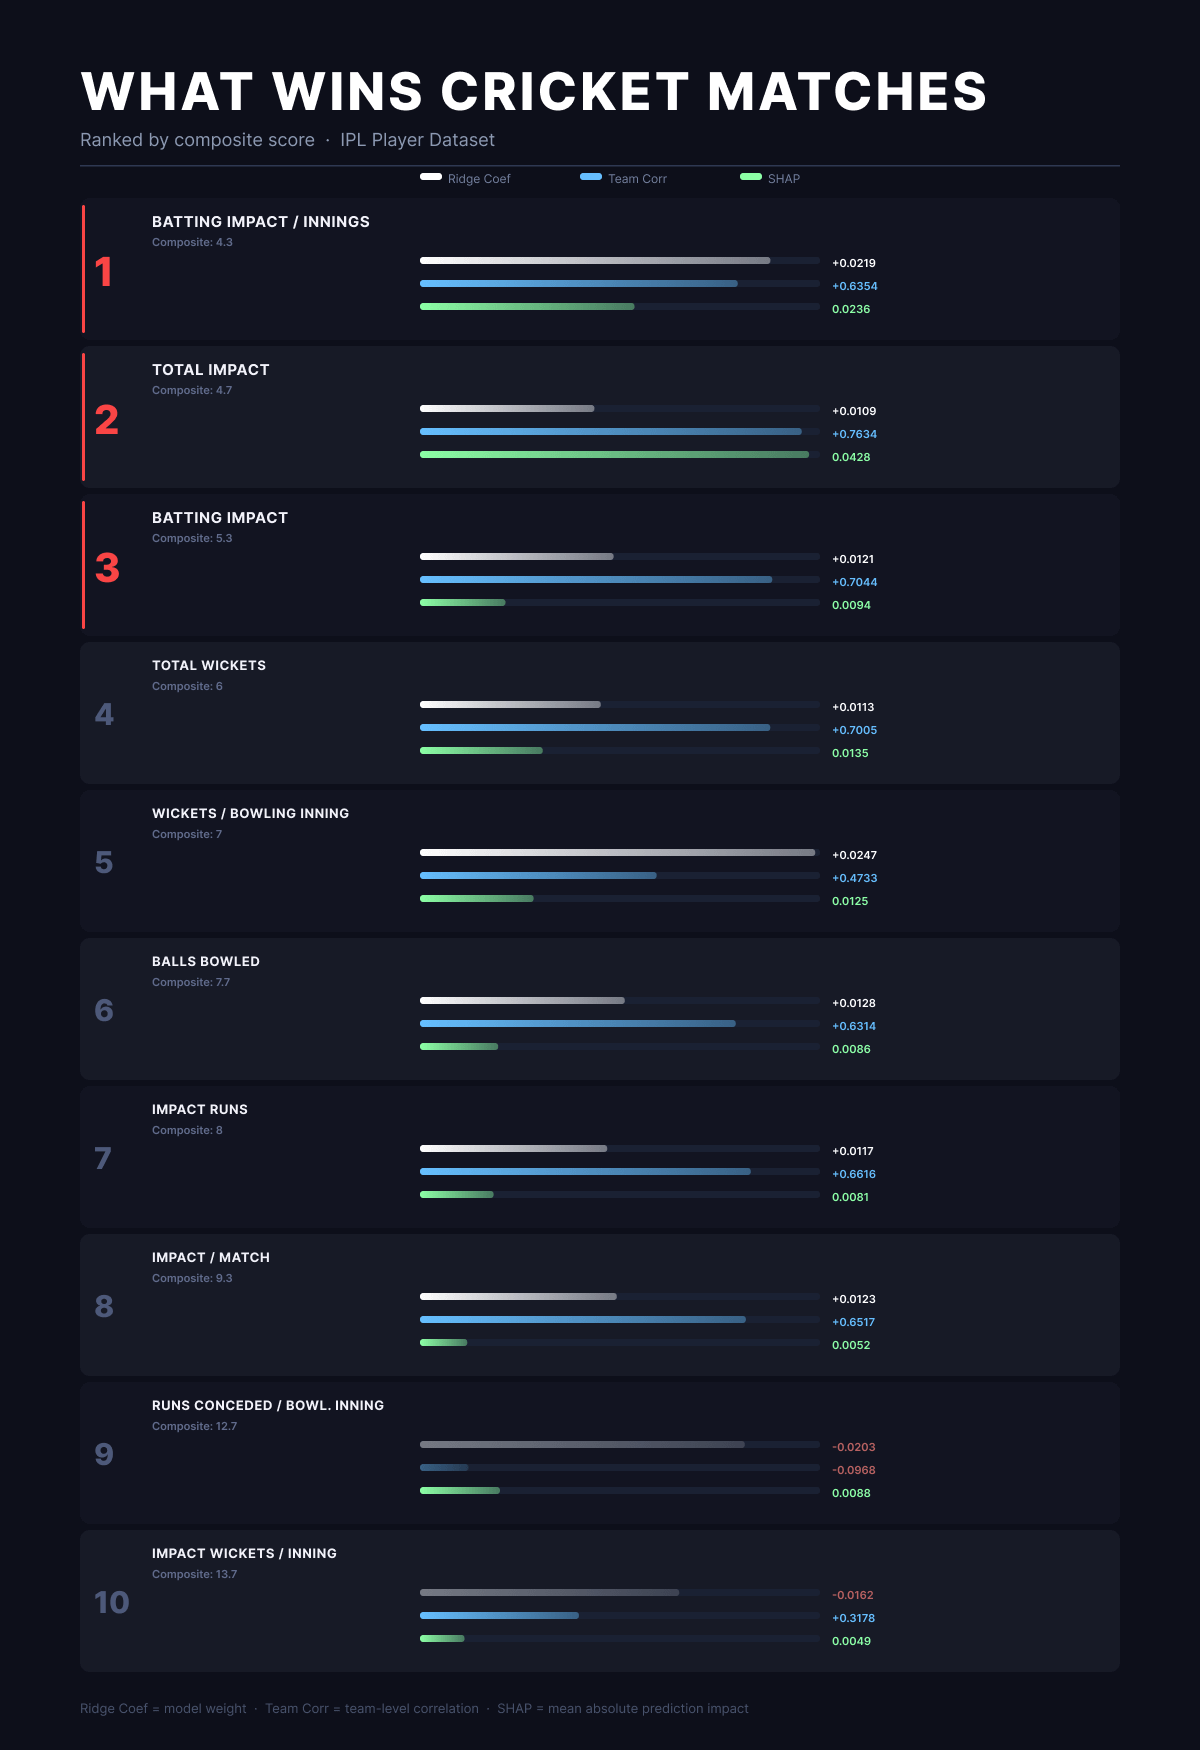
The results show that the IPL truly is a balanced competition between the Bat and the Ball, despite the recent surge in massive scores. The franchises that have sustained championship runs, CSK, MI, and KKR, have consistently had all-time great batters at the helm, backed by reliable and deep bowling attacks.
The second finding is that the results show the value of ESPN’s Impact Index. Impact matters more than volume. Impact stats rank much higher than their traditional counterparts, depicting that the model consistently rewards efficiency and leverage over accumulation. Four hundred runs against weak attacks in already-decided matches are worth considerably less than two-fifty in games that hung in the balance.
Step 8: Turning This Into a Player Number
With the model built and validated at the team level, the final step is projecting it back onto individual players.
Take a player’s complete stat profile for a season. Feed it into the model. Get a predicted win rate contribution. Now do the same for a perfectly average player, one whose results sit at the league mean across all 17 seasons. The difference between those two contributions, multiplied by the number of games in that season, is the wins contributed.
A player with a wins contributed score of +2.0 has been worth two additional wins to their franchise over the course of the season, compared to what a league-average player in that slot would have delivered. A score of -1.0 means a team with a more ordinary option in that role would have been expected to win one more game.
That is the number. That is Win Contribution.
Greatest IPL Seasons Ever
Now that we have come this far, let’s take a look at the greatest seasons ever (based on win contribution).
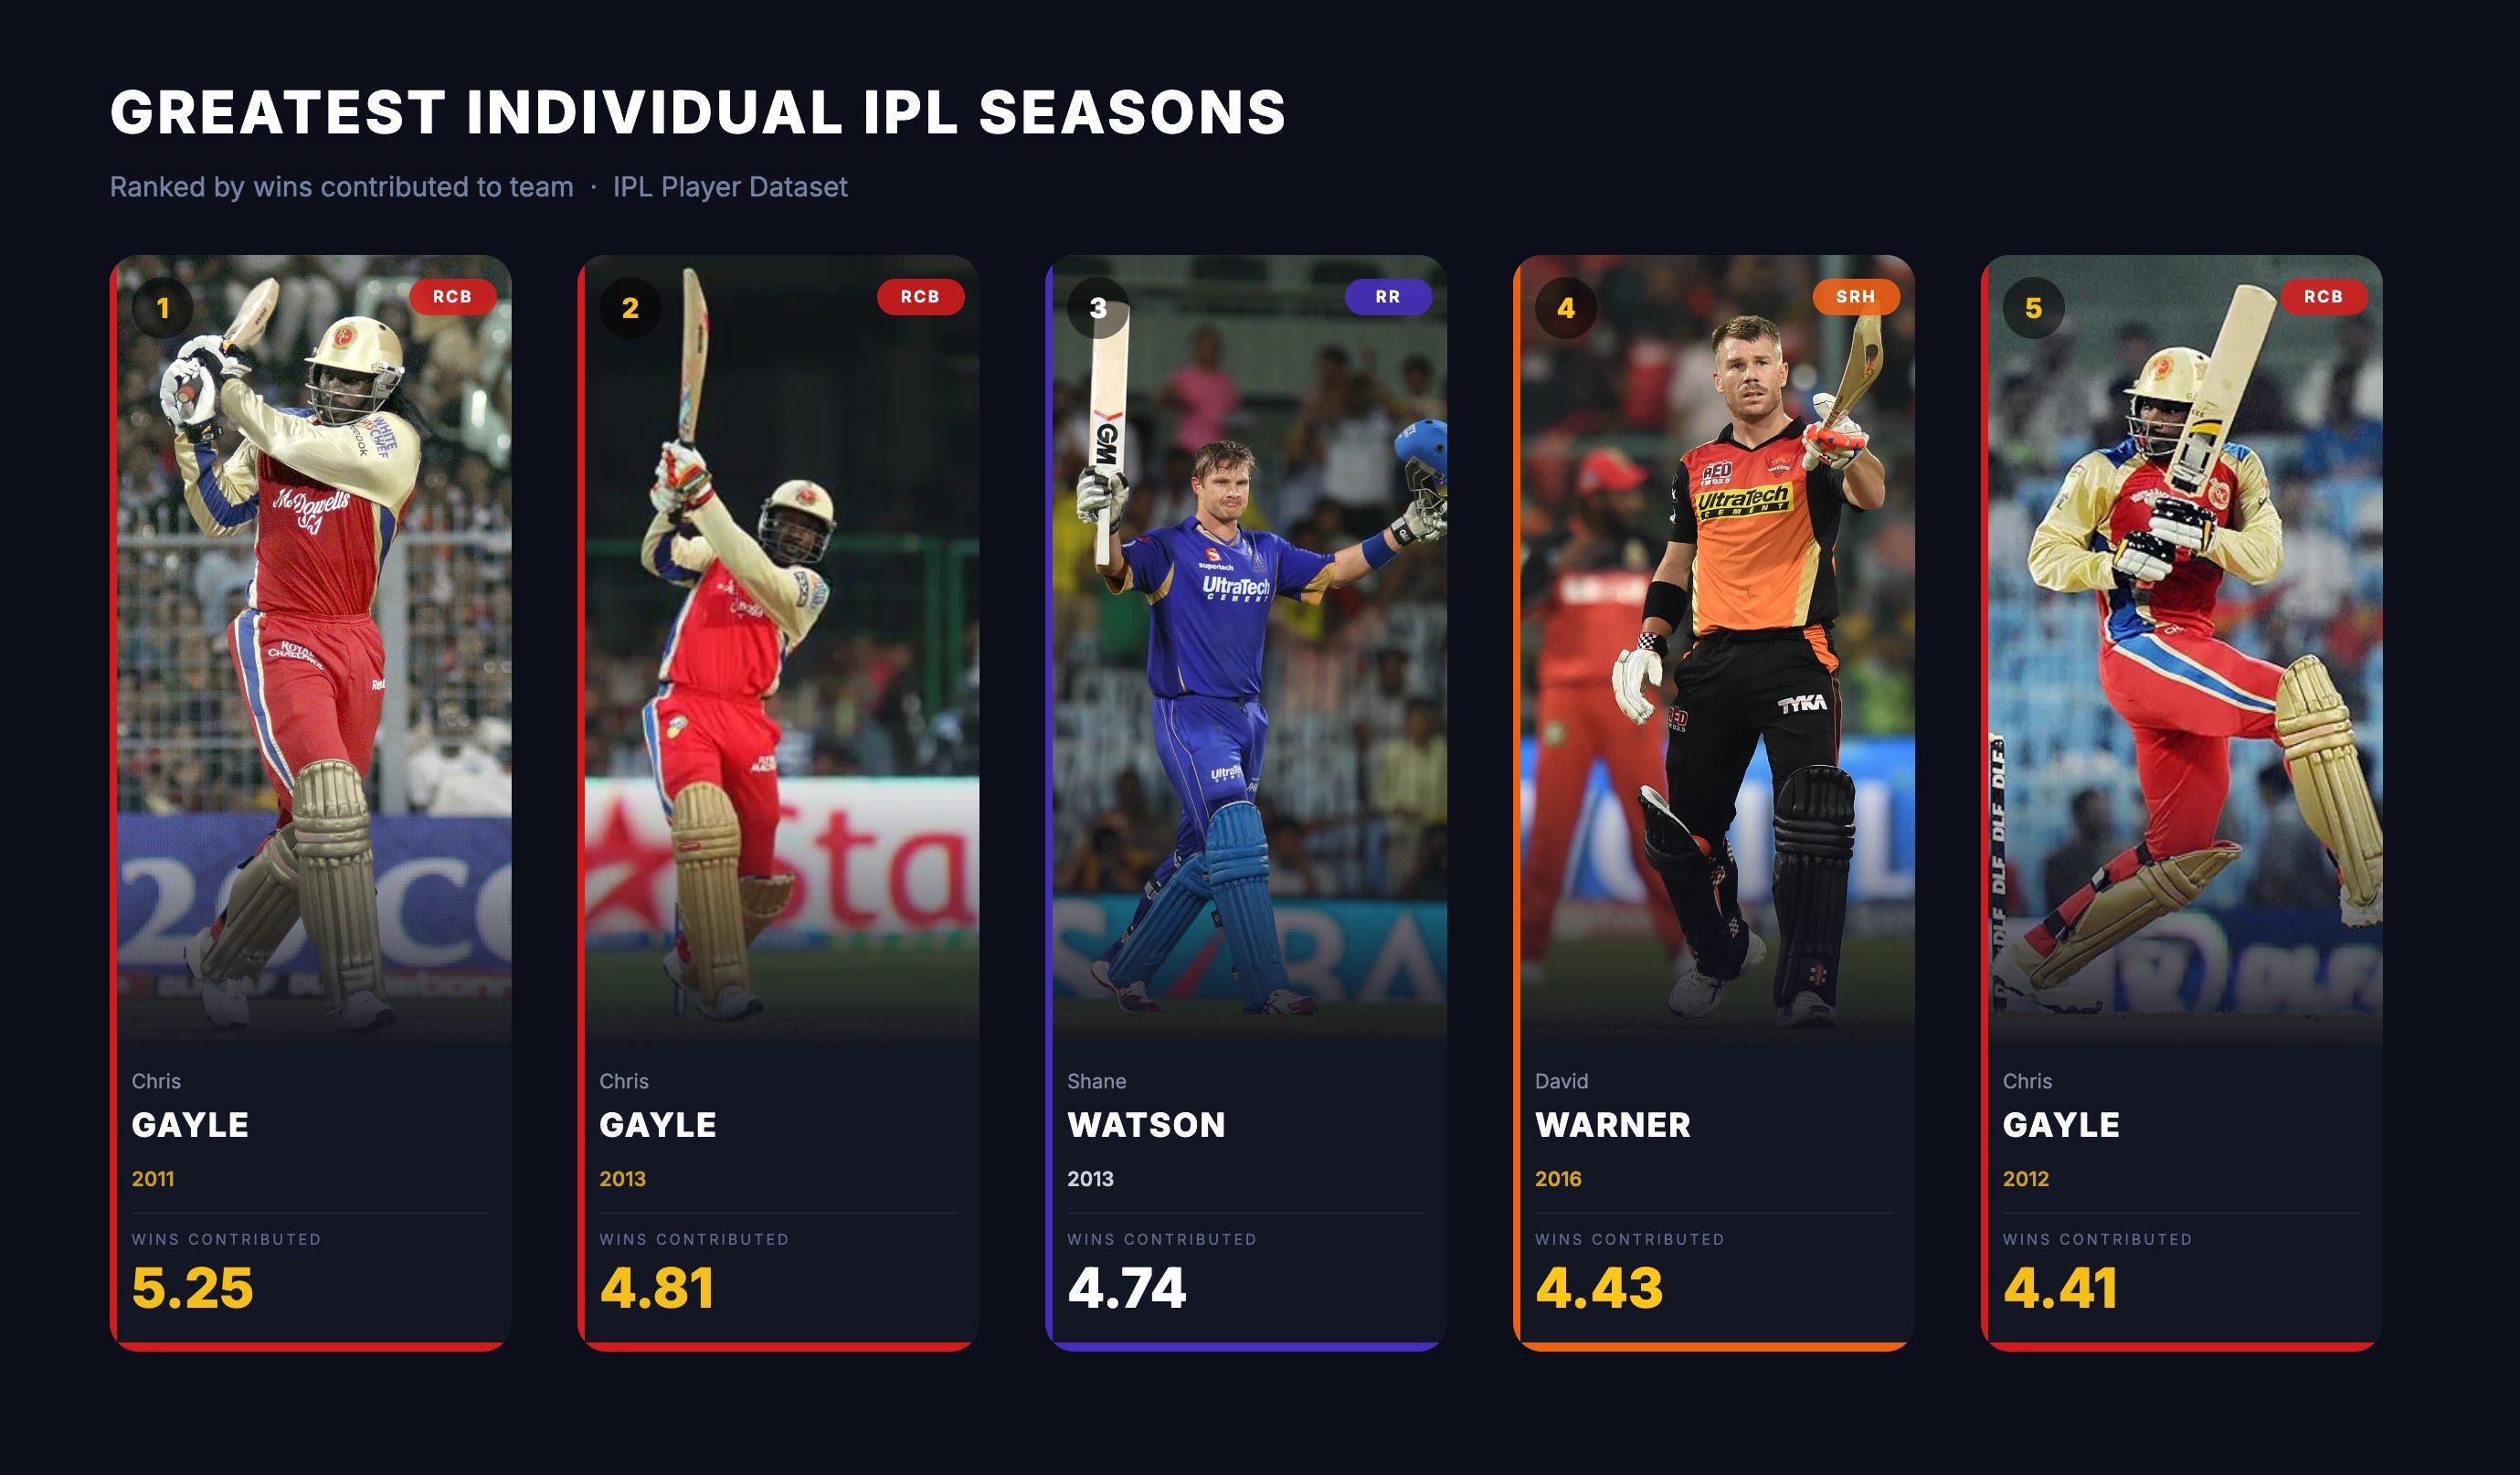
Right away, two things jump out.
These are all considered great IPL seasons.
At his peak, there was simply no one better than Chris Gayle.
The IPL will probably never see a player with his particular brand of destruction again. All Gayle needed was one over to get set, and if he did, the bowlers were in for a very long day. His ability to stay in one stance and hit everything back past the bowler, a shot selection that should not have worked as consistently as it did, is something the format won’t see again. The board reflects that legacy faithfully.
Shane Watson’s 2013 season is the definition of one man doing everything. Over 540 runs at a strike rate of 143, 13 wickets at an economy of 7.15, and Impact Index numbers that are extraordinary even by the standards of this list. Watson did most of his damage in the power play, when the game hung in the balance, exactly the kind of performance the Impact Index (and by extension, this model) was built to reward.
David Warner’s 2016 season deserves more flowers than it gets, and the reason it doesn’t get them is that Virat Kohli broke the single-season record by scoring 973 runs that season, a record that still stands. Kohli’s season is a notable omission here, and the explanation is instructive. He played most of his games at a small, high-scoring ground, surrounded by elite batting. The Impact Index doesn’t rate his season as highly because the context dilutes the leverage. Warner, by contrast, was carrying SRH almost alone. When your team has no reliable contributors beyond the openers, every run you score is worth more. The model sees that. Kohli’s 2016 win contribution sits at 4.03, which is excellent. Warner’s is just better.
Most Valuable Players (2026 IPL)
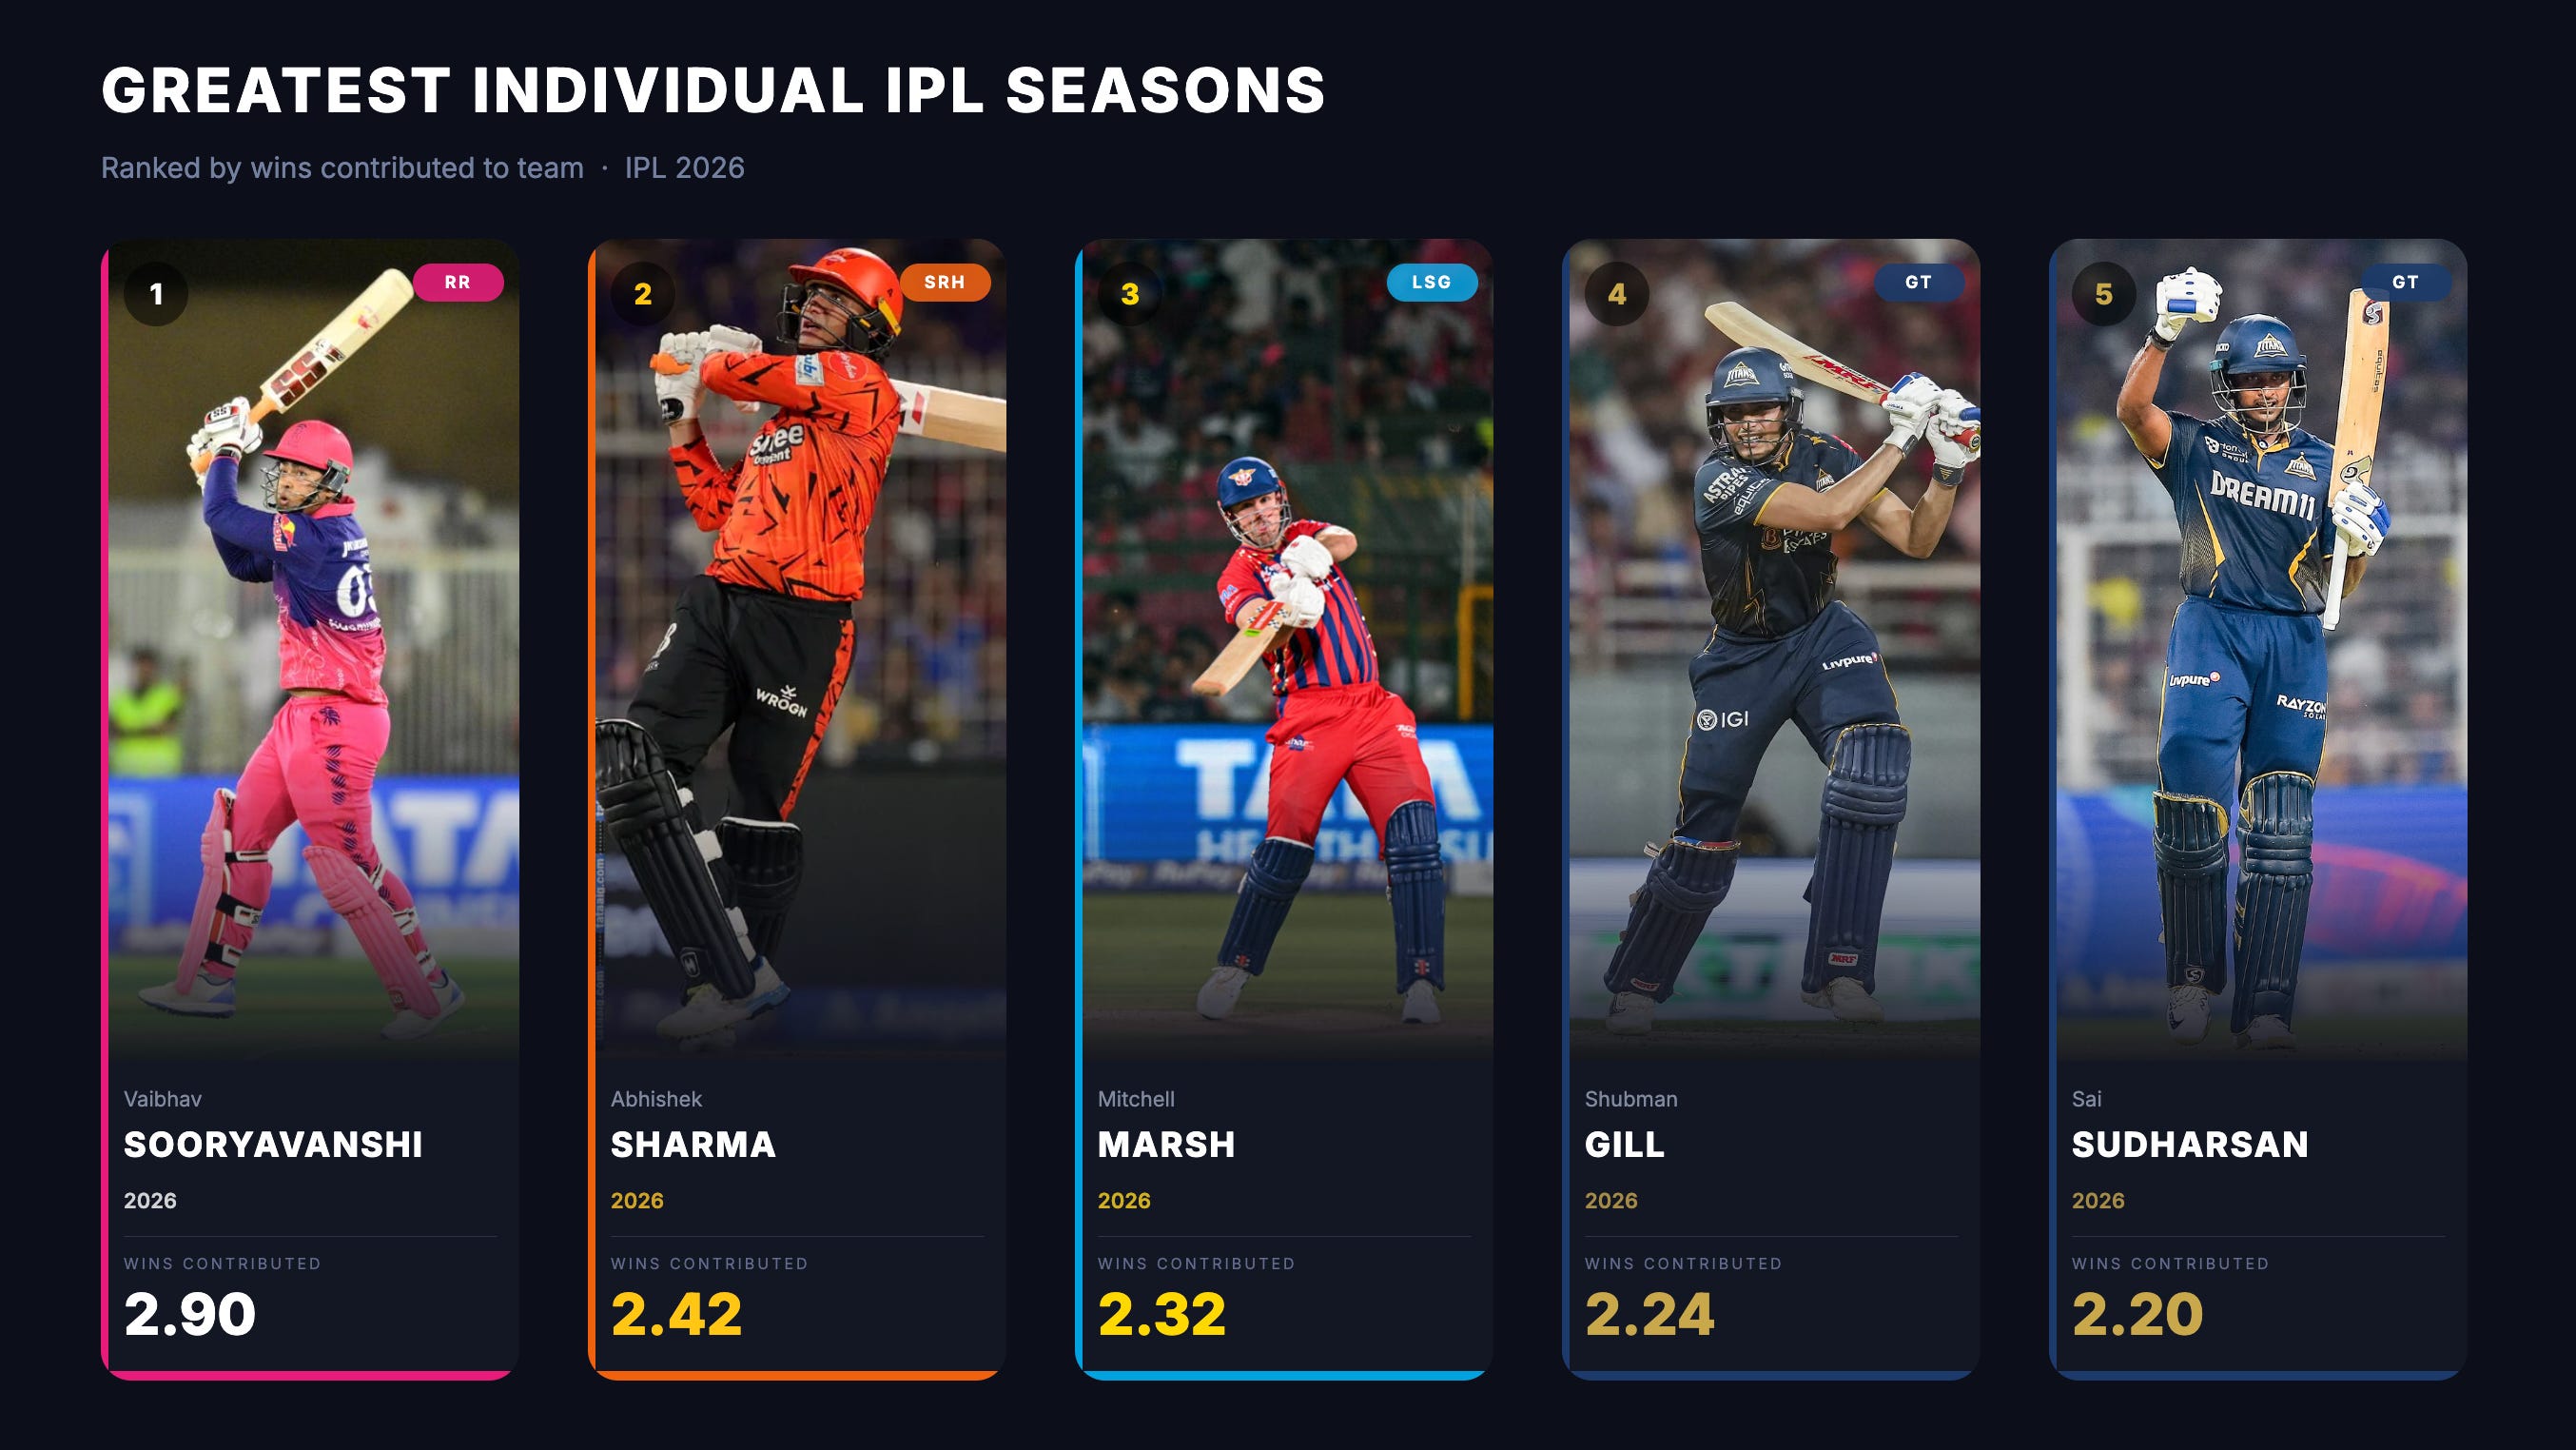
Vaibhav Sooryavanshi sits atop this list by a comfortable margin, and the numbers make a strong case for why. The 15-year-old has taken the cricketing world by storm, and among all players with over 200 runs in a season, his strike rate of 232.3 is second all-time, sitting above any single season by Chris Gayle, Andre Russell, or Kieron Pollard.
Abhishek Sharma’s case reads almost identically. Twenty fewer runs, a slightly lower strike rate, and a near-identical profile at the top of the order. Two openers, different franchises, both putting up historic hitting numbers.
Mitch Marsh was the one player worth watching on an otherwise forgettable Lucknow Super Giants side. In a season where LSG finished last, Marsh tallied 563 runs, 250 more than the next closest batter on his own team. Back-to-back 500-run seasons have quietly placed him in a very short list of sustained IPL performers, and he heads into next year with something to prove on a better roster.
Sai Sudharsan and Shubman Gill deserve a mention that goes beyond individual numbers. Their proficiency at the top propelled the Titans to a 9-3 finish after starting 0-2. Together they accounted for over 50% of the team’s runs, racked up three century partnerships, the most of any pair in the league, and consistently put up totals that the opposition couldn’t chase. We might be seeing the greatest IPL opening duo ever.
Notable Omission
The list tells a quiet story about how the game has changed.
As run tallies have ballooned across IPL seasons, the individual value of bowlers and all-rounders has eroded alongside them. Smaller grounds, flatter pitches, and rules increasingly tilted toward batters have compressed the margin between a good bowling performance and an ordinary one. The model picks this up. Our first all-rounder doesn’t appear until 9th on the list, Jamie Overton, and our first pure bowler until 10th, Bhuvneshwar Kumar. Across the entire top 20, there are only 4 pure bowlers and 2 all-rounders.
Perhaps there will be rule changes in the near future that create a more optimal balance between the bat and ball. For now, however, Batters reign supreme in the IPL, and Bowling has taken a backseat.