
Is Clutch Performance Predictable? Sources Say….Maybe
Measuring the repeatability and predictability of clutch performance
Introduction
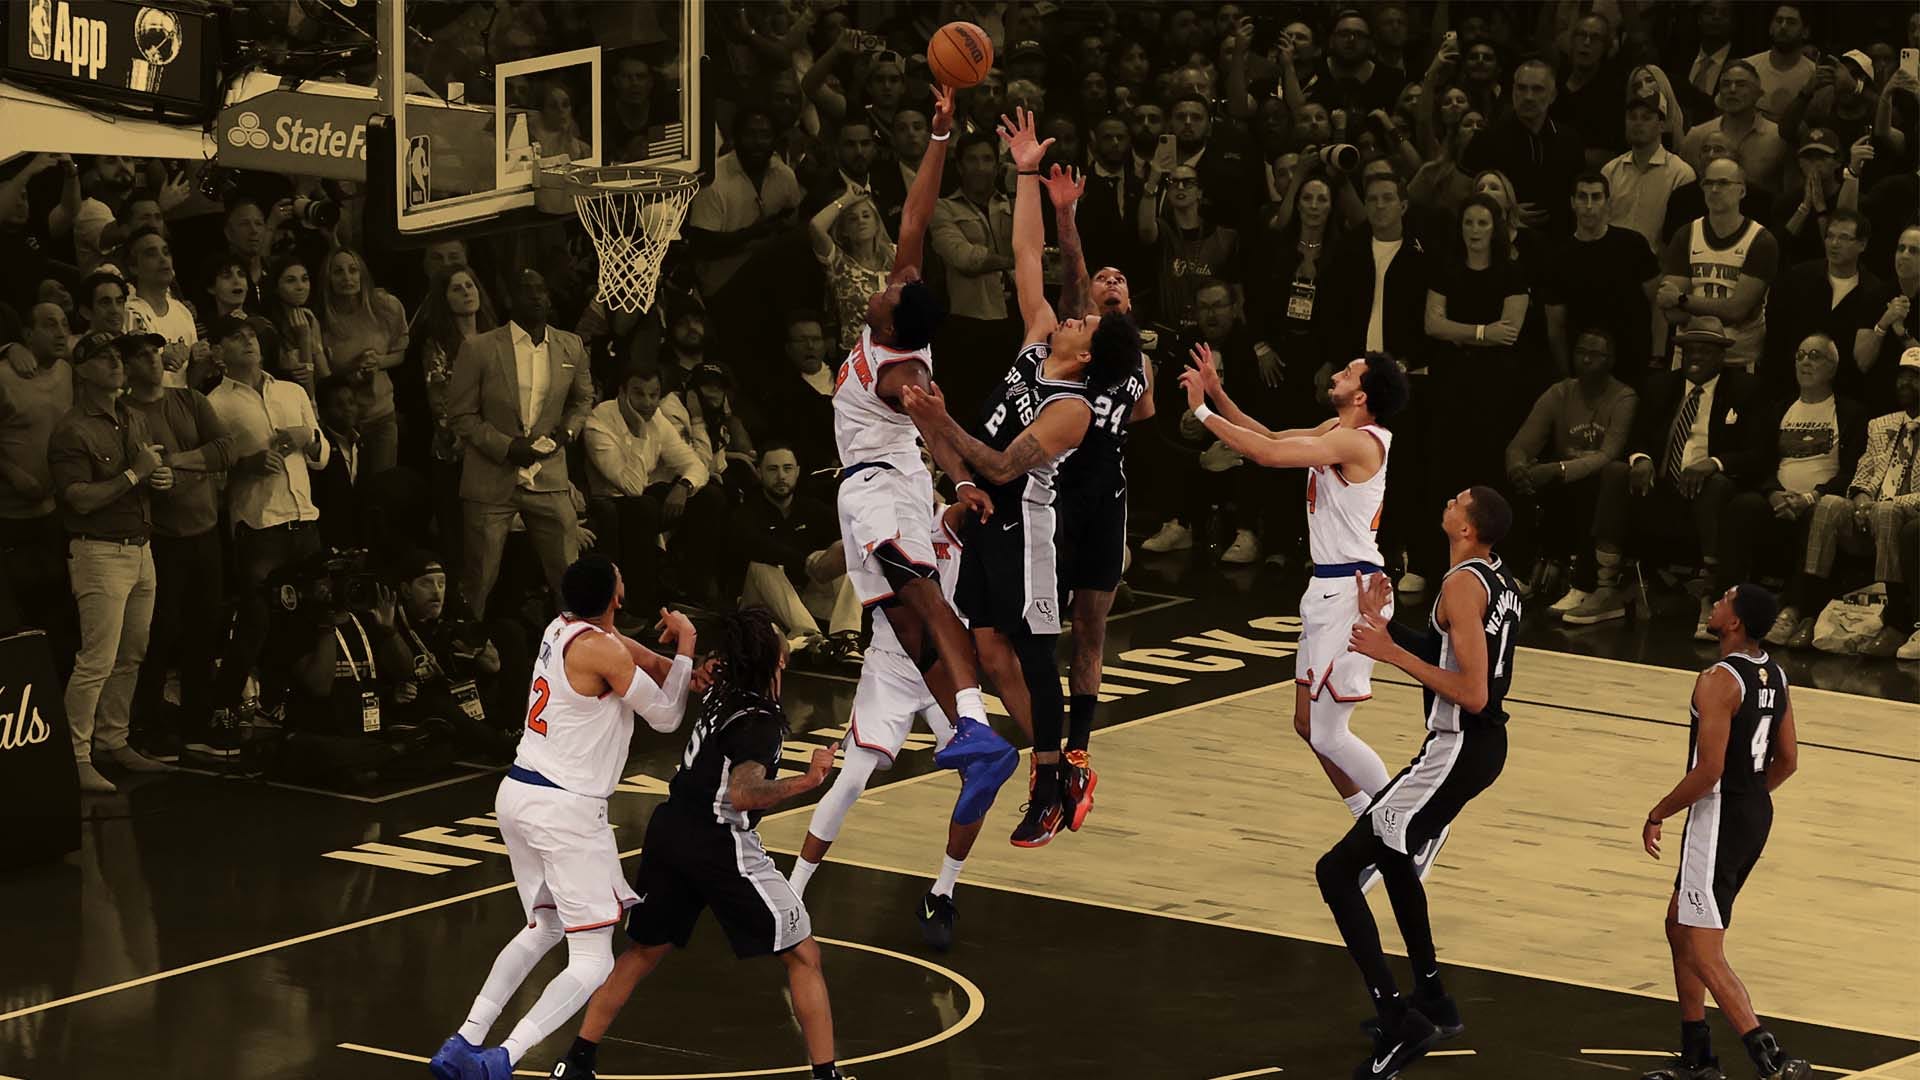
Some franchises win because of talent. The 2024-25 and 2025-26 New York Knicks won because of something harder to measure.
They went down 20 to the Boston Celtics twice in the same series and won both games. In Game 1 of the 2025-26 Eastern Conference Finals against Cleveland, they trailed by 20 with eight minutes left. They won. Against the San Antonio Spurs, they were down double digits in every single game they won across the series, including one where they trailed by 29 points in the third quarter, a deficit no finals team had ever recovered from until that night.
Three comebacks. Multiple opponents. A two-year stretch that looked, from the outside, like fortune. It wasn’t.
For most of basketball history, clutch was treated as part of a player’s makeup, something in the blood before the season started, not a skill that could be coached or measured. Jordan had it. Reggie Miller had it. Kobe Bryant built an entire career on it. LeBron famously did not have it. The data tells a more specific story.
Using 26 seasons of cWPA (clutch Win Probability Added), here’s an attempt at measuring the predictability and repeatability of clutch performance.
The Data
The clutch metric throughout this analysis is Clutch Win Probability Added (cWPA), sourced from inpredictable.com (specifically the win-probability-added section). It captures a player’s net impact on win probability during clutch situations, accounting for shots, turnovers, free throws, rebounds, assists, steals, and blocks. Positive cWPA means the player moved the needle in the right direction. The methodology is inpredictable.com’s own, and while we can describe the inputs, the underlying win probability model isn’t publicly auditable.
The dataset covers 26 seasons (2000-01 through 2025-26). For a season to qualify for the analysis, players must have played over 62 games in the regular season and over 10 in the playoffs. After filtering out injured players, first-round opponents, two-way contracts, and benchwarmers, we are left with ~5,500 qualifying regular-season player-seasons and 1,800 playoff entries.
Describing the Dataset
The median regular-season cWPA is 0.21, and the outlier seasons form a thin, wispy right tail, a sign of a dataset that skews heavily right. Then, somewhere out there at the very edge of the distribution, sits an almost unfathomable: 5.84, set by DeMar DeRozan in the 2021-22 NBA season. The next four are no less absurd:
5.48: LeBron James in 2007-08
5.44: De’Aaron Fox in 2022-23
5.19: Isaiah Thomas in 2016-17
5.04: Anthony Davis in 2014-15
The only five seasons in our entire dataset to crack 5 cWPA.
All-Time Regular Season Leaders
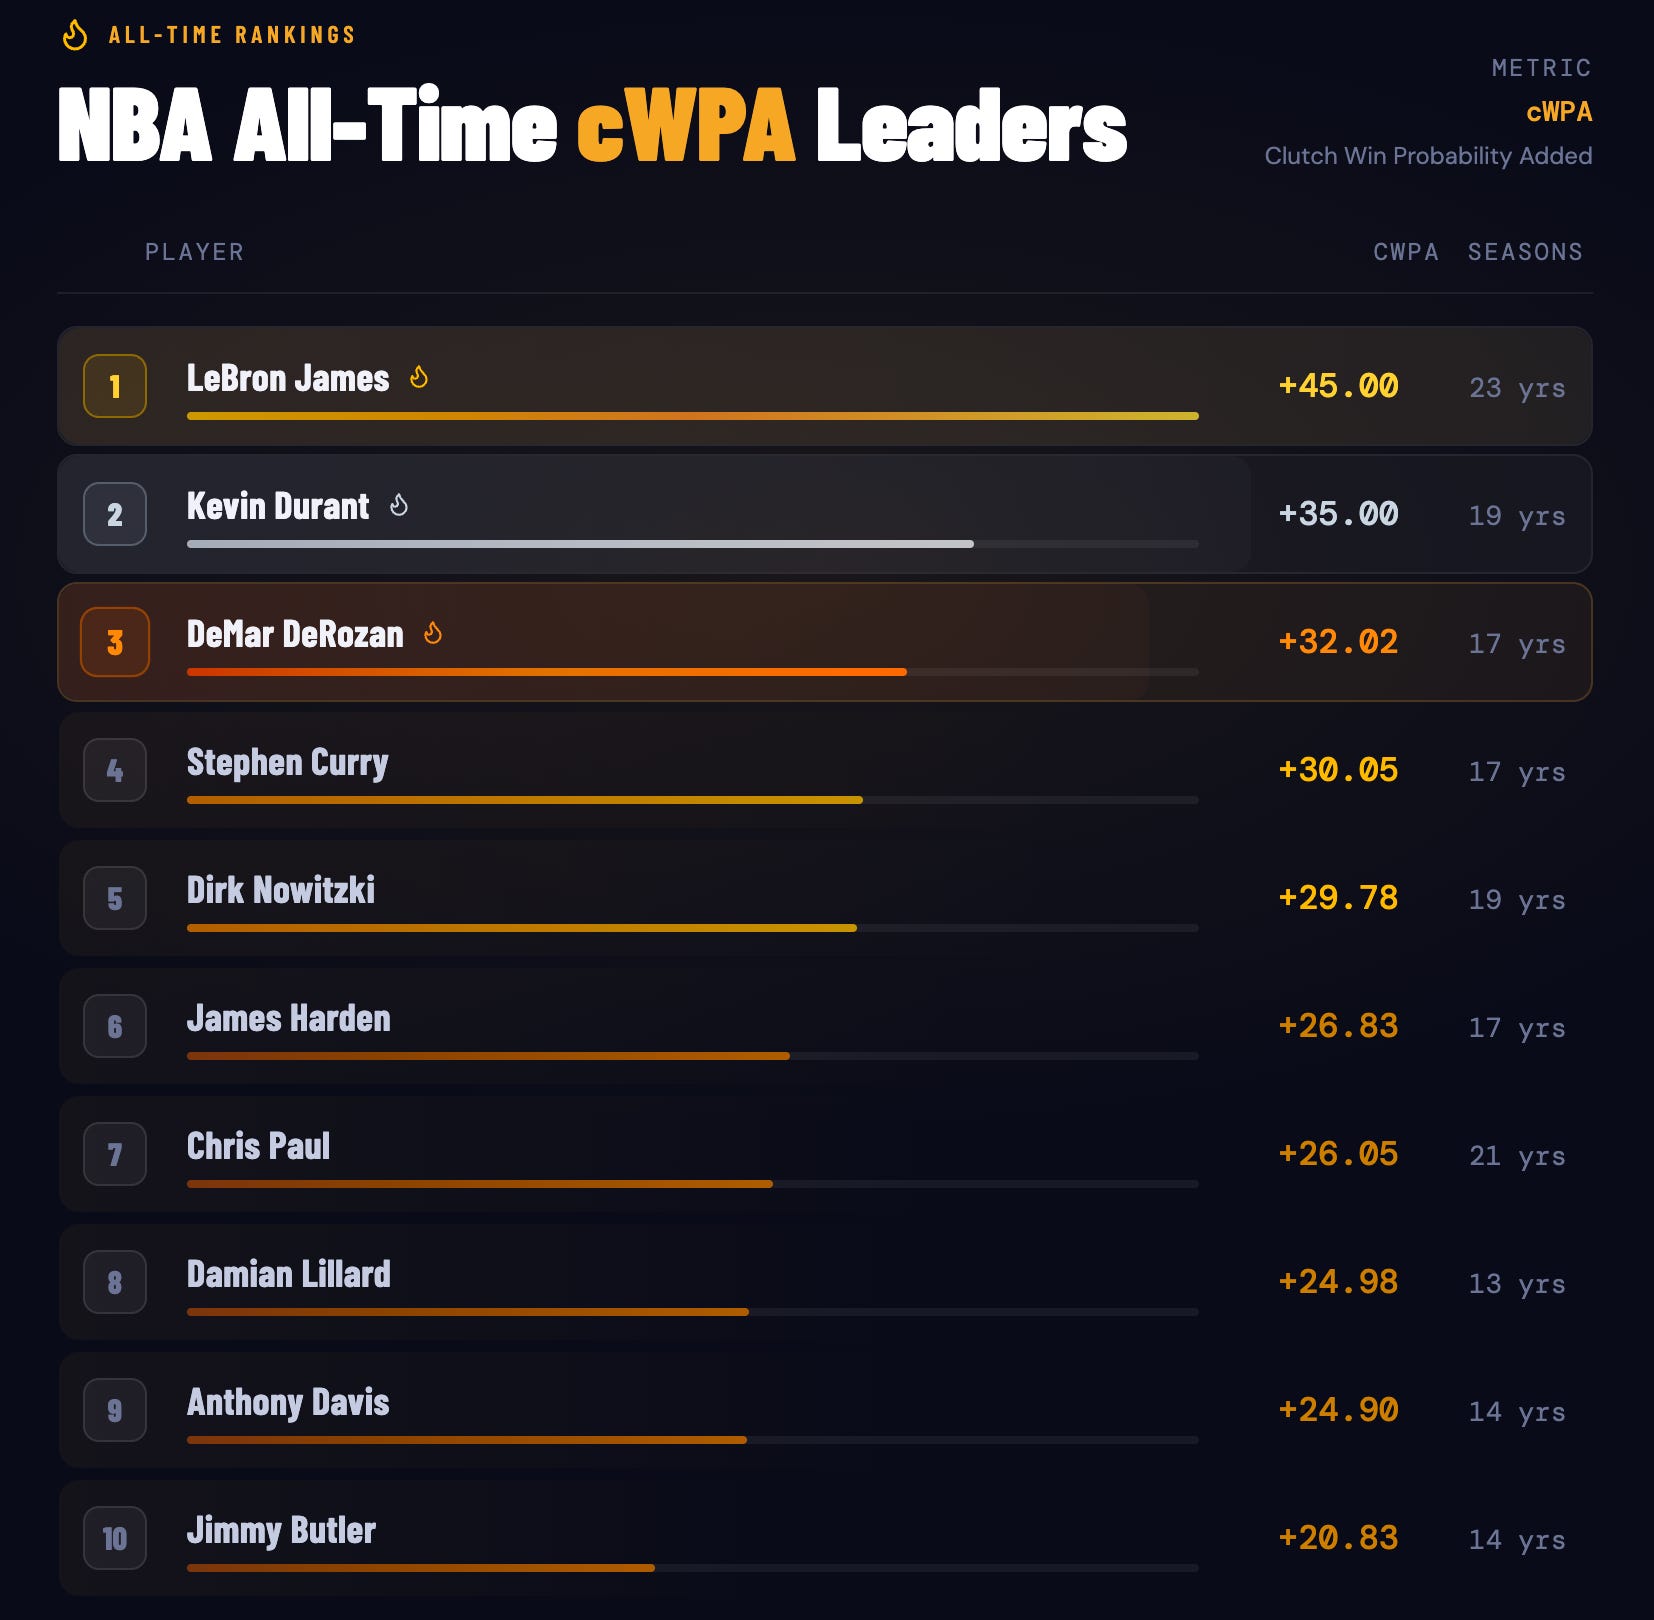
The list puts into perspective how dominant LBJ has been throughout his career; his spot atop the list clears KD by an unfathomable 10 cWPA, the same gap between Durant and Lillard (number 8 on this list). Skip Bayless has spent over a decade insisting LeBron has no clutch gene (from 2013 to 2017 to 2024, and even just a few months ago); the data has spent two decades disagreeing. The rest of the list is a masterclass in isolation scoring: Durant, Dirk, Harden, Curry, Lillard guys who simply cannot be guarded when a game is on the line. But keep an eye out for number 3 on this list. You will be pleasantly surprised.
Then, there’s the elephant in the room: Kobe Bryant, the patron saint of clutch mythology, nowhere to be found on a list that covers basically his entire prime. Images of Kobe pulling up from 25 feet, surrounded as he rose above them to hit the dagger, have never lost their place in NBA folklore. The vibes were immaculate; the math, apparently, less so.
All-Time Playoffs Leaders
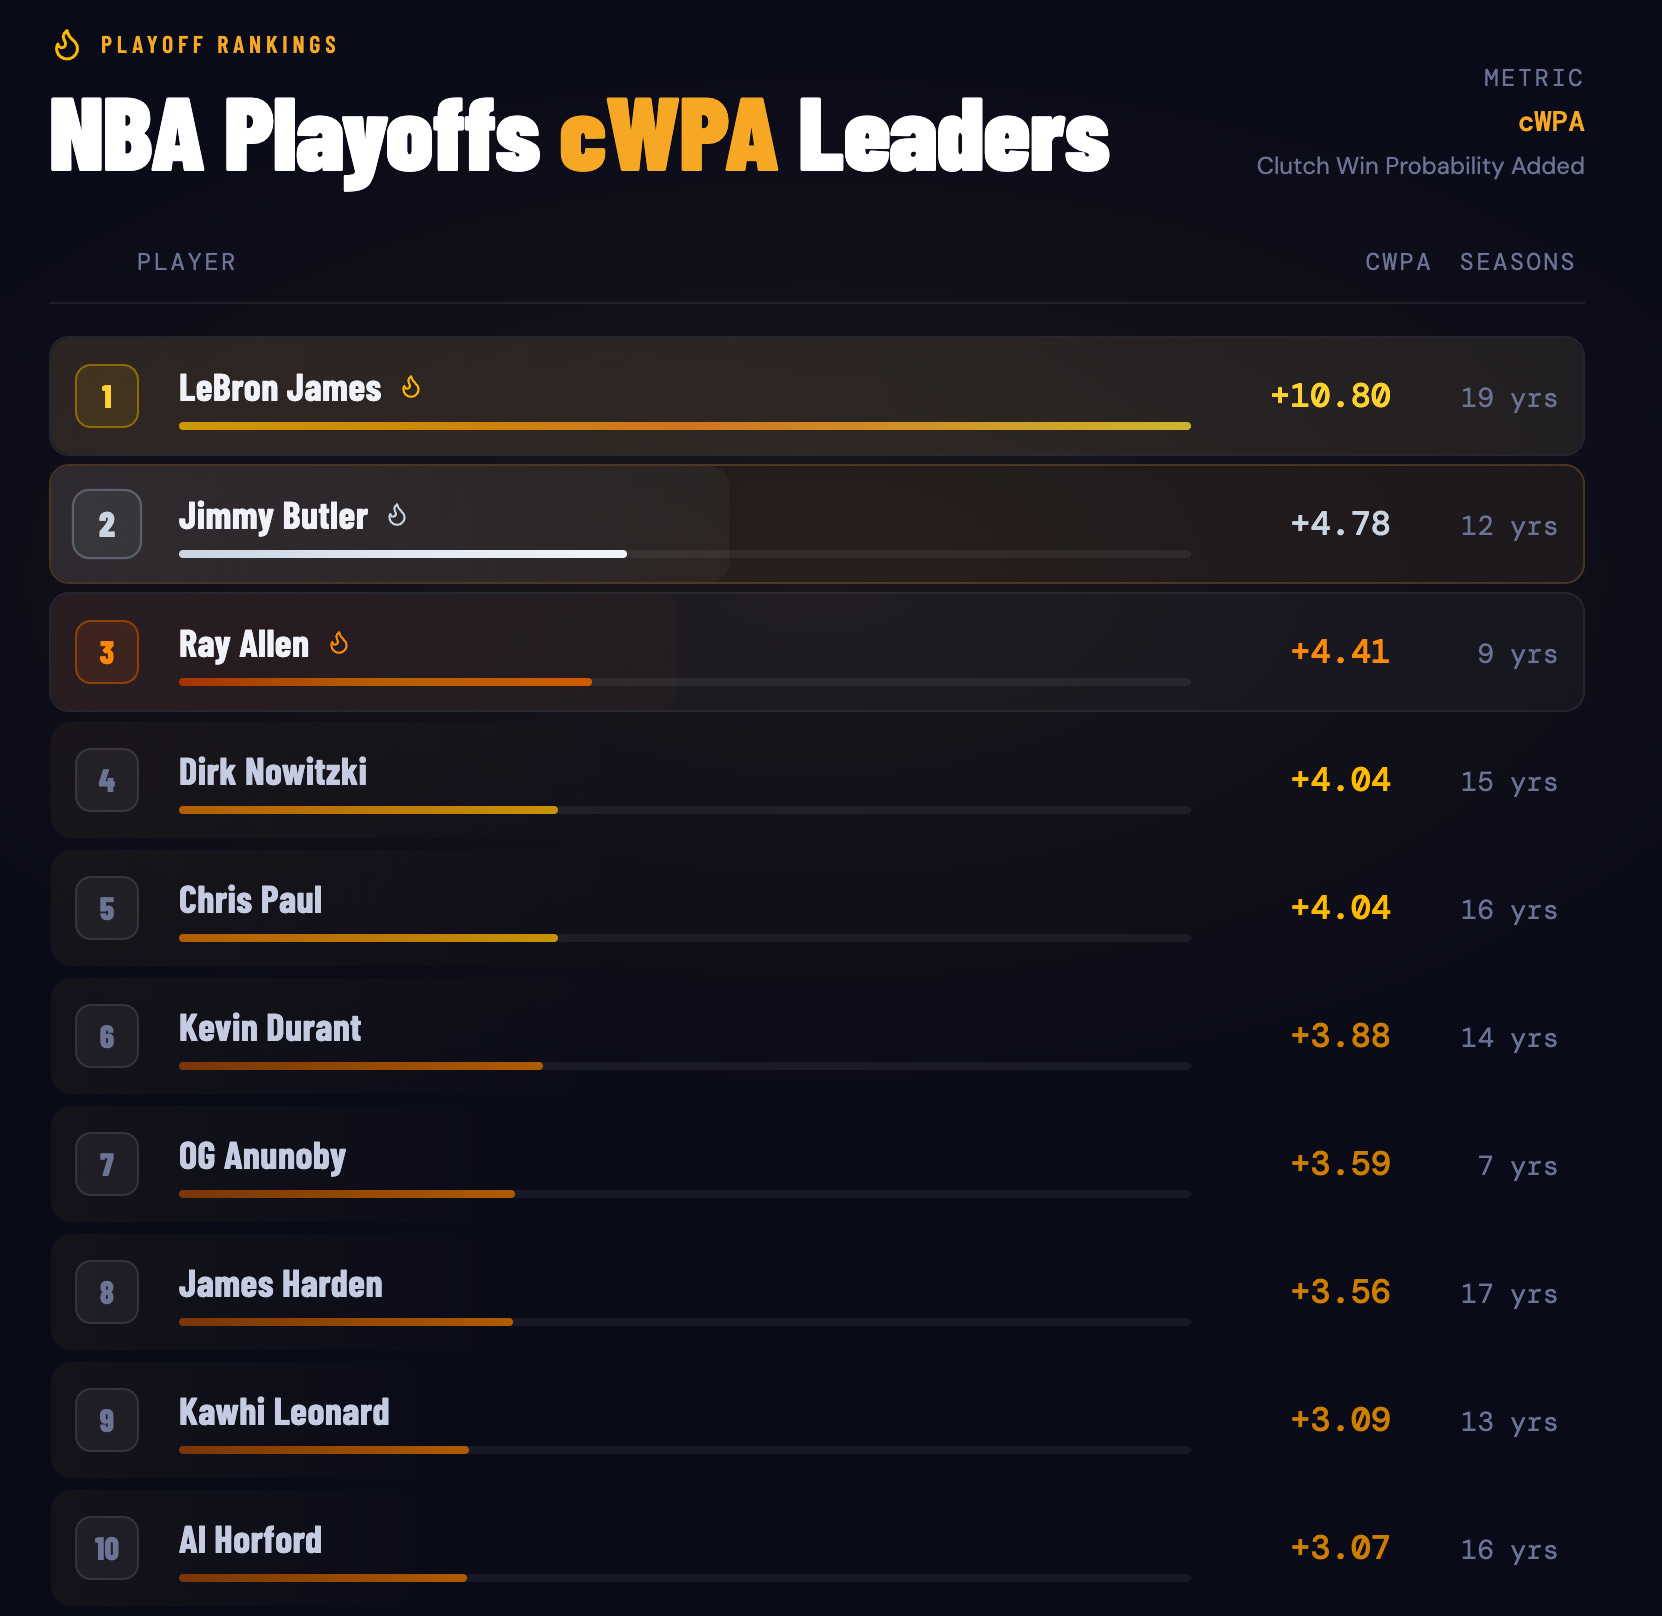
The playoff leaders graph shares some similarities, but the exceptions on this list are fascinating. Forget about LeBron. He is untouchable, with more than twice as many as Jimmy Butler at number 2.
However, Jimmy Butler at number 2? It’s shocking for the slightest of moments, until you remember that his tenure on the Miami Heat will forever live on. Finals appearances in 2020 and 2023 (beat both the 1 and 2-seed as the 8-seed) alongside an ECF appearance in 2022; those runs were powered by his brilliance when the game came down to the wire. Ray Allen at 3 is not shocking, and if you think it seems out of the ordinary, go check out this video on his incredible late-game shotmaking. And then, there’s OG Anunoby at number 7, buoyed by 2 incredible runs, 2025-26 and 2019-20, surrounded by extremely solid years.
Last 4 Regular Season Leaders
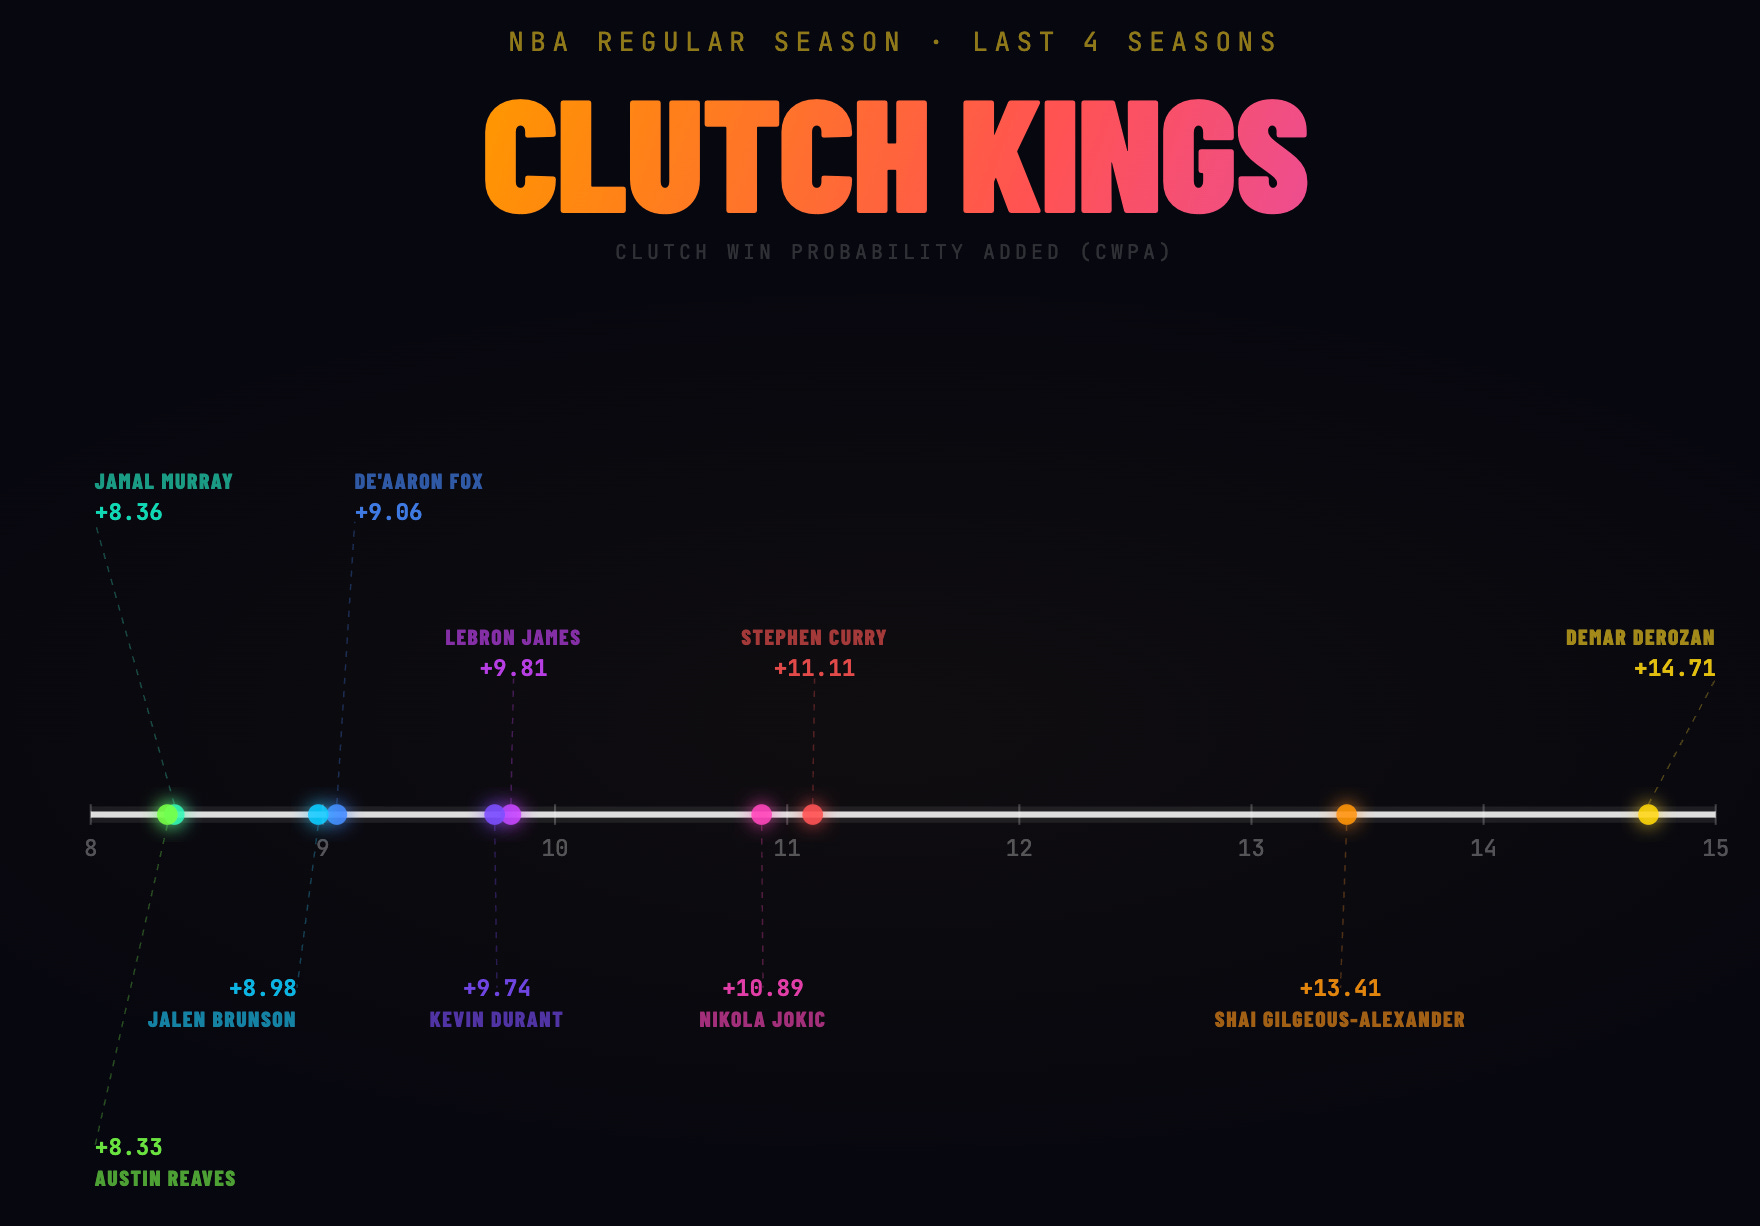
It is shocking that when we think of clutch players, DeMar DeRozan’s name is not brought up more often. Even over the last 4 seasons, towards the end of his career, DeRozan leads the NBA by a significant margin.
Alongside Austin Reaves, he is the only surprise on this list. Everybody else on this list can be the answer too: “Who do I want taking the last shot?”
Last 4 Playoffs Leaders
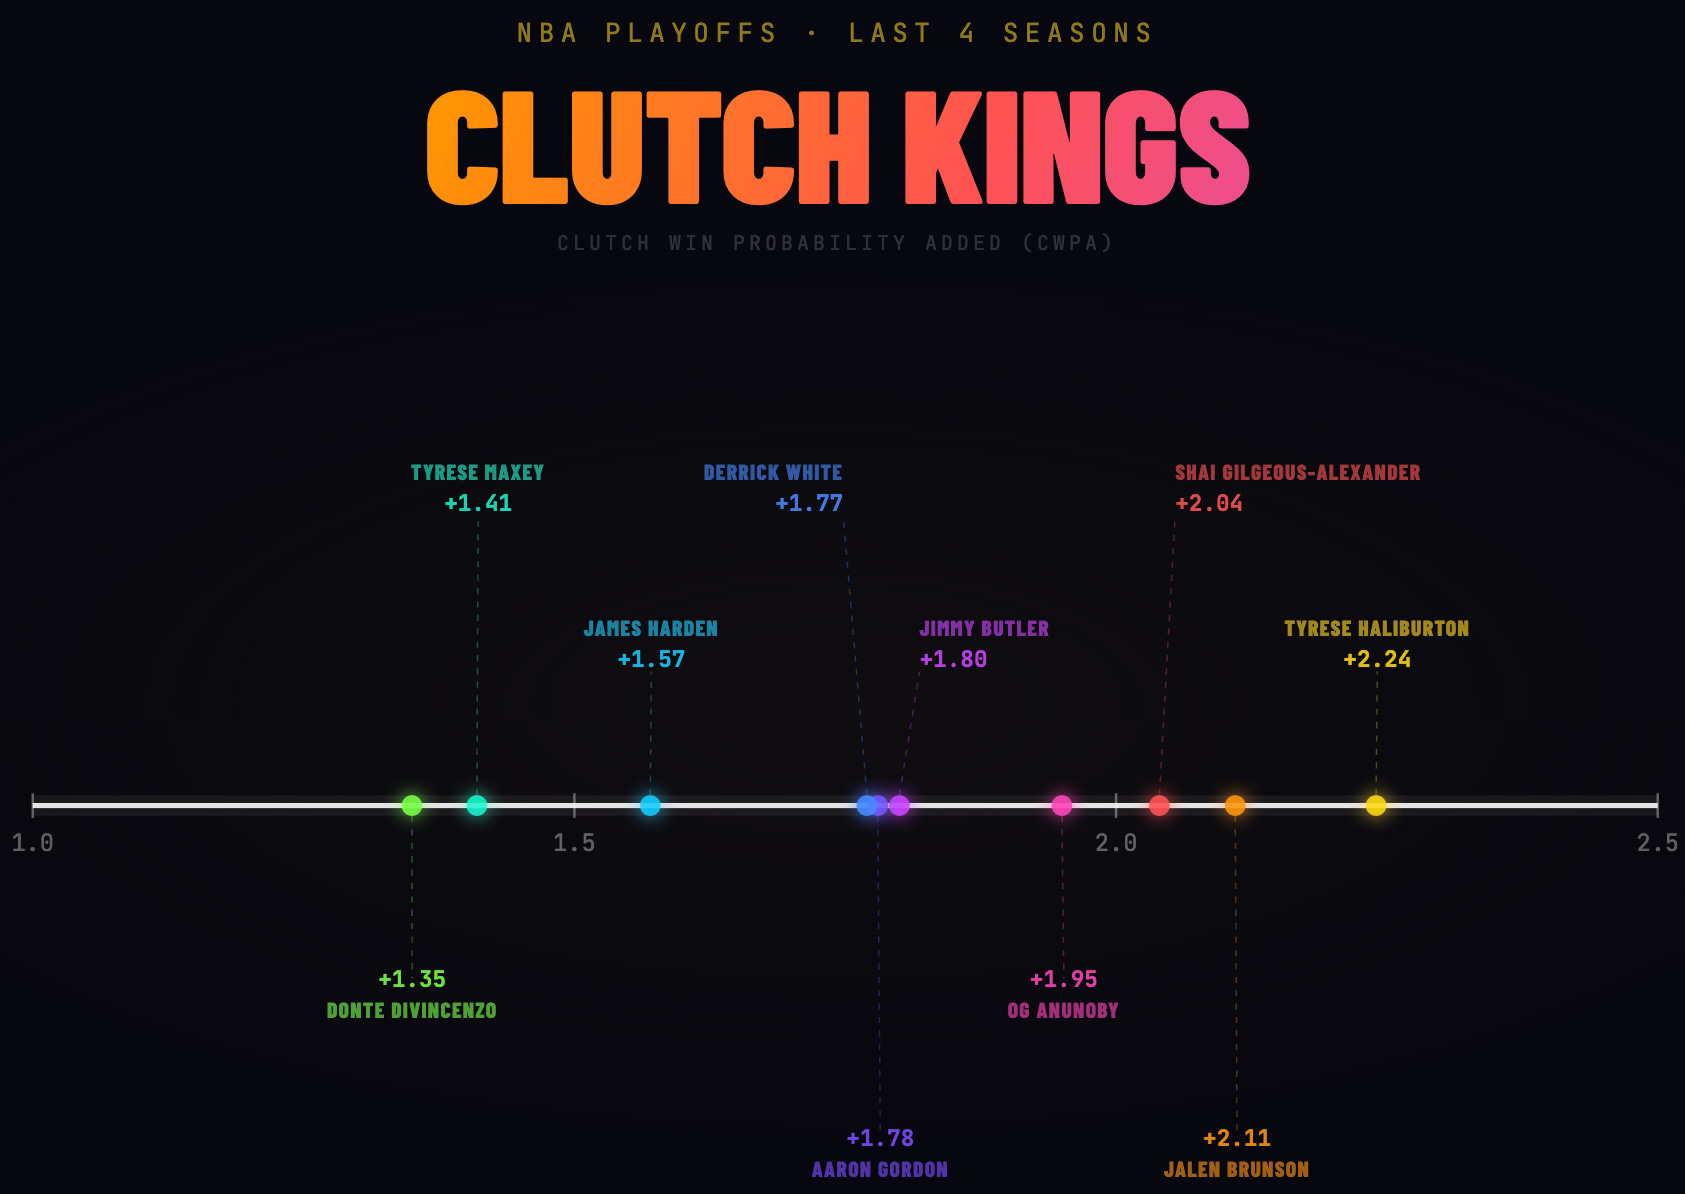
The best single playoff clutch season in the 26-year dataset? Haliburton, 2024-25, at 2.63. Dirk Nowitzki’s 2010-11 run (2.15) held that record for over a decade. Haliburton’s 5-year cumulative is offset by a poor 2023-24 performance (-0.39).
Perhaps the biggest surprise is James Harden’s inclusion on this list. Or maybe not. Harden’s dismal performances come in clutch games, not necessarily clutch moments. While his record in Games 5, 6, and 7 is consistently poor, those are no different in our dataset than a Game 1 in the series. All that matters is the score with 5 minutes left.
That does beg the question. How do you weigh playoff performances against each other? Perhaps that’s a future blog topic.
Do Players Repeat Their Clutch Production?
To test how well clutch performance transfers, three correlation analyses were performed: regular-season year-over-year, regular-season-to-same-season playoffs, and combined year-over-year. Each scatter plot below shows R², the share of variance explained.
Regular Season, Year Over Year (R² = 0.26)
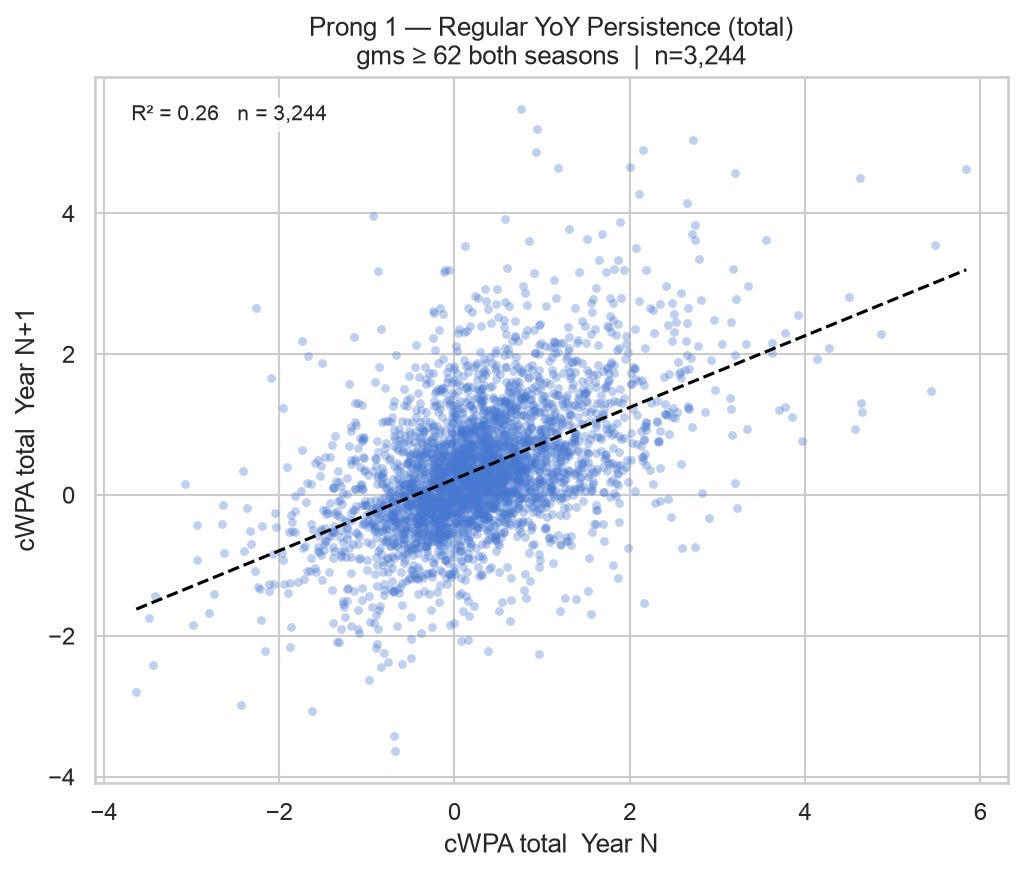
Across 3,244 consecutive season pairs, a player’s cWPA from one year explains 26% of the variance the next. But 74% of the variance just... escapes. Injuries, roster overhauls, a shrunken or inflated role, a new system, and one bad month. The game has too many moving parts to be fully captured by any single number, and cWPA is no exception.
Regular Season to Same-Season Playoffs (R² = 0.15)
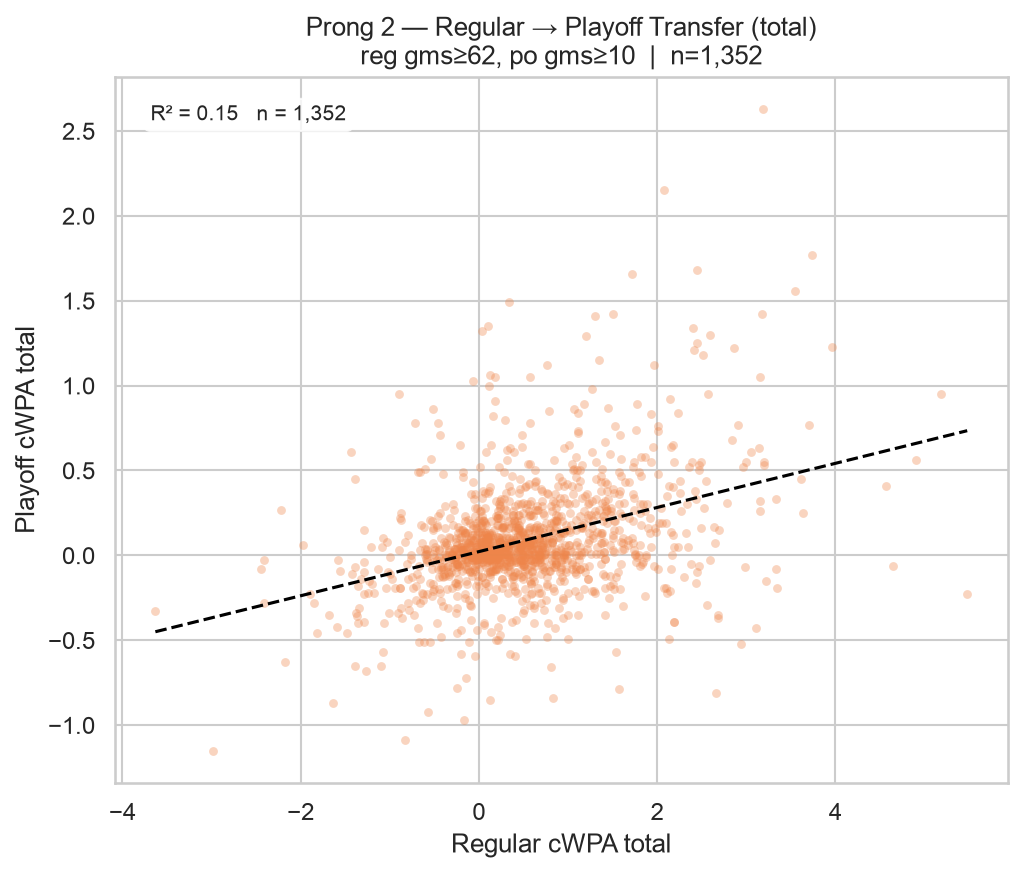
Across 1,352 player-seasons qualifying in both regular season and playoffs: the regular season explains 15% of playoff clutch variance, an 11% drop from the previous number. The other 85% is marred by small sample, better game plan, and a dangerously thin player pool. The number isn’t zero, so the regular season isn’t completely useless. But 15% is closer to a rumor than a blueprint.
Combined Year Over Year (R² = 0.31)
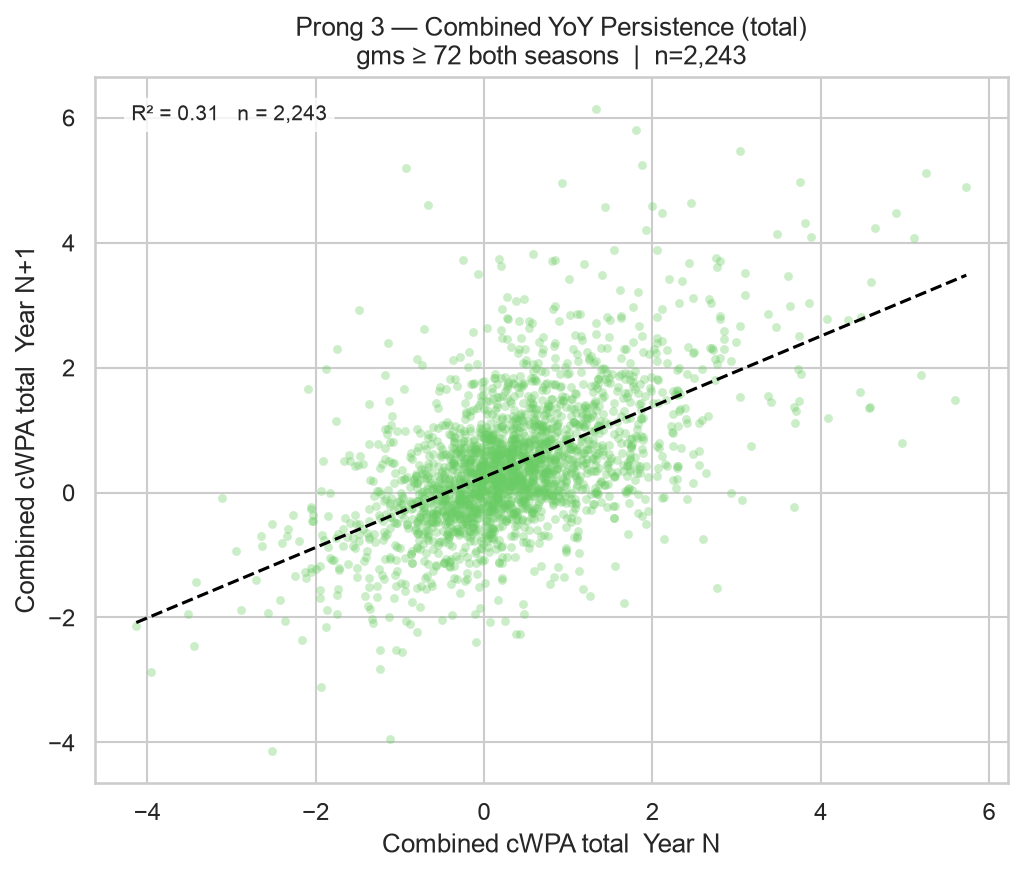
Folding regular season and playoff clutch into a single combined figure raises the year-over-year signal to R² = 0.31. A player who is clutch in both gives stronger evidence of a real skill than either number alone. Combined cWPA is the best single predictor of future clutch performance available in this dataset.
What Box Scores Can (and Can’t) Explain
After the correlation, I wanted to see if clutch performance could be predicted by a player’s regular-season numbers (from Basketball-Reference.com). To do this, an XGBoost model trained on 21 seasons of data was tested on the data from 2021-22 to 2025-26. XGBoost builds an ensemble of decision trees that can handle complex, nonlinear interactions between stats. 44 standard box-score statistics, narrowed to the 20 most predictive. The target: same season.
The results were fascinating:
Regular-season model: 46% of the variance is explainable (test R² = 0.46).
Playoff model: 27% of the variance is explainable (test R² = 0.27).
Both outperform the naive baseline of predicting the league, but more than half of the variance in both cases remains unexplained.
What the Models Learned
Regular season: Leans on efficiency. True Shooting % leads, followed by turnover rate, effective field goal %, and points. Players who convert cleanly and don’t lose the ball produce a positive clutch WPA.
Playoffs: Volume meets value. VORP anchors the model, followed by offensive win shares, effective field goal %, and free throw attempts. Playoff clutch production tracks closer to overall player quality. The best players see more reps when the stakes spike, and they cash in.
Both models indicate that good players tend to be clutch, but they don’t prove it definitively. If clutch performance were just a downstream effect of talent, the R² numbers would be a lot cleaner. They’re not. This points to two player builds: someone who performs well for most of the game but fails under the brightest lights, or a role player who does what’s expected before donning the cape in the final moments.
The Players Who Beat the Model
cWPA Difference = Actual - Predicted.
Who overperformed and underperformed their expectations?
Regular season over-performers, 2021-2025:
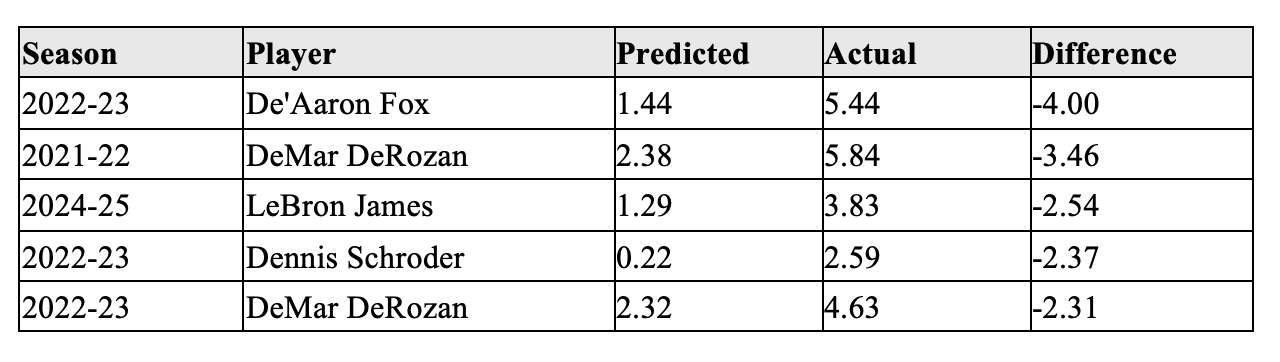
De’Aaron Fox’s 2022-23 season is the biggest outlier. Once again, DeMar DeRozan makes an appearance. His shot selection looks inefficient on paper; a mid-range specialist in an era where those do not exist anymore. But when it matters, he converts those shots at a rate no box-score stat captures. The model sees a player with an average TS% and projects modest clutch output. DeRozan delivers something else entirely.
Playoff over-performers, 2021-2025:
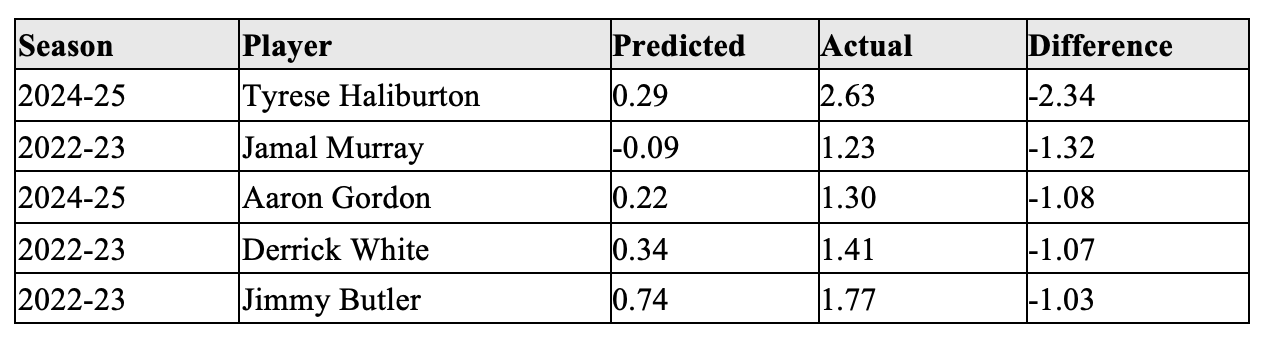
Haliburton’s 2024-25 playoff season is the model’s biggest miss in the entire playoff dataset. The projection was 0.29 cWPA, consistent with his low regular-season numbers. In 2023-24, he underperformed, posting -0.39 when the model expected 0.31. In 2024-25, he delivered 2.63, the single best playoff clutch season in the 21st century.
The Players Who Disappointed the Model
Regular season under-performers, 2021-2025:
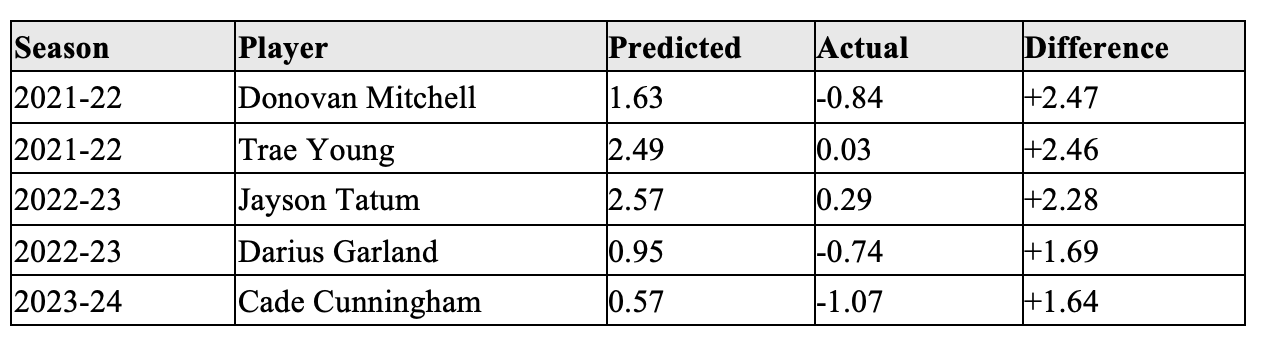
Donovan Mitchell and Trae Young share the two biggest regular-season misses in the test data. Mitchell’s efficiency stats implied a strong clutch producer. The model expected 1.63; he posted -0.84. Young’s profile was similarly elite: TS%, OBPM, scoring volume all pointed toward strong clutch production, a 2.49 projection, and 0.03 actual. Neither was hurt. Both weren’t delivering when it mattered the most that season.
Tatum appears twice across the test window, 2022-23 and 2023-24, as a significant under-performer. His regular-season production and efficiency consistently suggest elite clutch output. He has consistently failed to meet expectations.
What This Means
The model captures a floor of expected clutch performance based on overall quality. Efficient, high-usage players often beat the average. But the over-performers point at something that simple box scores cannot: shot selection within clutch situations, how a player’s tendencies shift under pressure, or simply the variance that comes with small samples.
DeRozan, Brunson, and Haliburton all delivered beyond what their box scores implied, while Young and Tatum repeatedly fell short. Whether the gap is a stable skill or a combination of tendencies and noise is harder to discern. However, the players who over-performed expectations are those who you’d want with the ball in the final minute.
Conclusion
Clutch performance repeats from year to year. R² = 0.26 year-over-year. It is a real, measurable trait. The players leading the rankings one season will likely be above average in the next. Chris Paul and Kevin Durant were positive in all 13 of their qualifying seasons.
Clutch performance does not transfer to the playoffs. The signal is barely existent. Just because a player performed well in the regular season, there is no guarantee he will be able to repeat that in the playoffs.
Combined production is the strongest predictor of future performance, with R² = 0.31. If you want to know who will be reliably impactful in high-stakes situations next year, look at the combined ledger.
Perhaps all this analysis leads us back to where we began. Despite its existence, one cannot determine what indicates clutch performance. The players who produce consistently are doing something that simple box score stats can only partially explain.
In that manner, maybe the basketball purists were correct. It is a rare talent, a “gene”, if you may, possessed by a select few, and glorified by everyone.